
This is the third update article based on the draft. The first article ranked the draft classes from 2007 to 2019, and the second explained the values of draft picks. That second article laid the foundation for this article, which will rank the teams based on both the expectations of their drafted players and the drafted players’ statistics in their first six post-draft seasons.
If the teams were ranked solely on the drafted players’ statistics, Edmonton would be in first place: McDavid and Draisaitl were pretty good players in their first six seasons. But Edmonton also had a wealth of high draft picks in the period being studied, so their team total should be high.
Teams will be rated using a return-on-investment (ROI) approach. The team investment is the expected PR-Points (PrPts) from a draft pick, while the return will be a player’s PRPts from his first six post-draft seasons.
I’ve already mentioned it twice, and this third time will be the last time that drafted players are evaluated solely on what they did in their first six post-draft seasons. Anything they do after that doesn’t matter in terms of rating and ranking them for the draft.
Team Investment
The following table shows the expected 6-year PR-Points of drafted players, based on the group they were drafted in.
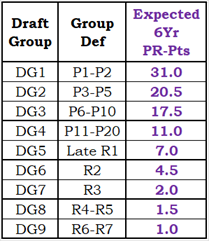
Note that the expected return decreases as you go deeper in the draft. This should not surprise you at all, as the best players are almost always selected first.
The table also shows that teams do a good job of identifying the potential of players. If drafting players were like buying lottery tickets, the expected returns would be all over the place: seventh-round picks could be better than first-round picks, and that certainly doesn’t happen in any professional league where new players can be selected in a draft.
Player Return
Adam Fox was drafted in the third round, 66th overall, by the Calgary Flames. Fox didn’t play until the 2019-20 season, and by then, he had been traded twice, first to Carolina and then to the New York Rangers.
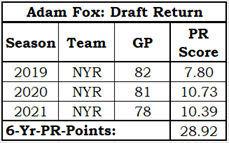
Which team is credited with Fox’s results? Calgary. I am evaluating teams based on their talent recognition when drafting, not on their talent retention after the draft.
Adam Fox’s return was excellent for a third-round draftee, even though he only played three seasons. Calgary’s “investment” was 2.0 PR-Points, and Fox’s “return” was 28.9 PR-Points.
Team Evaluation
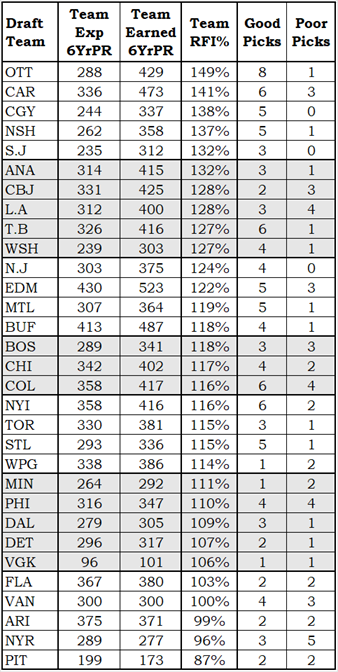
To evaluate a team’s draft results, the first step is to add together all of their drafted skaters’ expected 6-Yr-PR-Points. This produces the team’s draft investment. Step number B is to add together the PR-Points of their drafted players, producing their draft return. A team’s return on investment (Draft ROI) is simply the return divided by the investment, expressed as a percentage.
Edmonton’s investment in drafting players was 430 PrPts (rounded to the nearest whole number), and those players generated a return of 523 PrPts. Both figures are the highest in the NHL. Their Draft ROI is 122%, which is the twelfth highest in the league.
Buffalo’s investment is 487 PR-Points, and their return was 413 PR-Points. Both figures are the second-highest in the NHL. Their Draft ROI is 118%, which is the fourteenth highest.
Pittsburgh’s investment is 199 PR-Points, lowest in the league (excluding Vegas and Seattle, of course). Their return is 173 PR-Points, the lowest in the league, and their Draft ROI is 87%, also the lowest in the league.
You now know which team has had the worst result from their drafted players. You may be surprised to see which team has had the best results, especially if you are a fan.
That was a bit of a teaser. Before I get to the results, let me first deal with some possible criticisms.
Possible Criticisms
I have some experience in creating personnel measurement tools and in the reactions to those tools. PR-Score, VR-Score and GxPts (Goalie Expected Points) are all “personnel measurement tools” if your personnel are hockey players. So let me address some of the criticisms I would expect to hear if I were doing a podcast on this subject.
“You missed players.” No, I absolutely did not miss any players. Every single skater that was drafted between 2007 and 2019, from Patrick Kane to Jeremy Mitchel, was evaluated.
“You absolutely missed players. Where is Joe Thornton? Where is Connor Bedard?” The key phrase that may have been misunderstood is “between 2007 and 2019.” Thornton was drafted in 1997, and Bedard was drafted in 2023.
“Okay. But your evaluations are incorrect. [My favourite player] is ranked lower than [some other player who is undoubtedly better].” It can be tough to argue with ardent fans, especially in areas where you cannot prove they are wrong. While I admit that PR-Score is not a perfect measure of a hockey player, I know that there will never be a perfect measure. PR-Score has proven itself over and over as an excellent method of evaluating players: Auston Matthews, when healthy, is always near the top of the league, while Ryan Reaves, in any state of health, is always near the bottom of the.
“Your PR-Score method underestimates physical players like Auston Watson.” No, it doesn’t. There is no statistical evidence that hitting leads to winning: from what I see, losing leads to hitting. If anything, PR-Score overvalues hits.
“Your PR-Score method underestimates defensive players.” I will agree with this, to a small degree. Statistics that identify defensive play are few and far between. My recent update of the PR-Score formula improved its measure of defensive play, and the PR-Scores for all players for all seasons (back to 2007) have been recalculated.
“What about longevity? Patrick Kane has played for nearly 20 years, so why isn’t he rated more highly?” There are two reasons for using a six-year time limit: it allows me to compare players based on them having an equal opportunity to accumulate statistics, and it prevents the “draft stars” from simply being a list of good players that were drafted before 2012. If I evaluated draftees solely based on their contributions from day one, Patrick Kane (2007 #1 pick) would be far ahead of Connor McDavid (2015 #1 pick). It would be stupid to say Patrick Kane is a better player than Connor McDavid.
No more teasers: it is time to see which team has had the best draft performance between 2007 and 2019.
Team Draft Results
The Senators are leading the league in something? Should there be a recount?
I was surprised, and so I did a couple of things to verify these results. The counts of good picks and poor picks were part of that verification process and will be explained more fully in the next section. A good pick is a player who far exceeds his expected 6YrPRPts, while a bad pick is a player who is well short of his 6YrPRPts.
Carolina, Calgary and Nashville come next. Between them, they had 16 good picks and 4 bad picks.
The average Draft ROI in the league (including Vegas) is 118%. The average team has had 4 good picks and 2 bad picks.
Toronto is below average at drafting, a bit of a surprise considering they drafted Auston Matthews. It is hard to give Toronto much credit for picking Matthews, as no team in the league would have chosen anybody else at number one. Ignoring Matthews, Toronto would be ranked below Detroit.
Pittsburgh traded away many of their draft picks (their future) to improve their team immediately (their present), and has not done a great job with the picks they kept.
The Rangers have not had great success with the players they drafted. Their expectation is one PR-Point more than Ottawa’s (289-288) but, due to five poor picks, their return has been much lower (277-429).
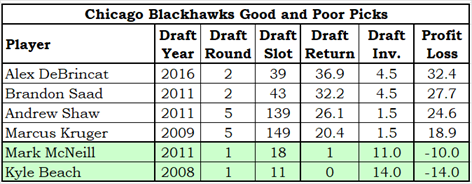
Draft Highs and Lows
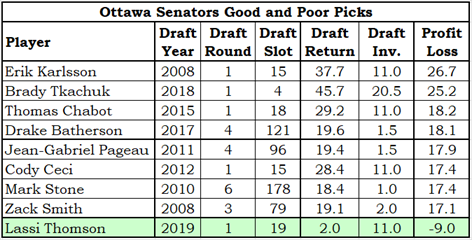
In the following tables, the good and poor picks of several teams will be displayed, all without further commentary (you’re welcome).
A “good pick” is a player whose 6-Yr-Pr-Pts is 15.0 or more above his draft group’s expectation. Adam Fox is an example of a good pick. He was drafted 66th overall by Calgary in 2016. He accumulated 28.9 PrPts against an expectation of 2.0 PrPts.
A “poor pick” is a player whose 6Yr-PrPts is 7.0 or more below his draft group’s expectation. Zach Senyshyn, chosen 15th overall by Boston in 2015, accrued 1.9 PrPts against an expectation of 11.0 PrPts.
Ottawa gets to go first, given that they are the “best drafting” team. Carolina and Calgary are up next, as they were second and third. Chicago is included as they have had four good picks and two poor picks, which is the league average. The New York Rangers are listed last due to their five poor picks.


Summary
Ottawa will almost certainly retain the lead in this category after next season, as Tim Stutzle and Jake Sanderson can then be included. The Rangers will continue to languish as Alexis Lafreniere will also be included: he won’t be a bad pick, but he isn’t the star most people thought he would be. Teams want more than a third-line center from the #1 overall pick.
Are draft results a matter of luck or skill? It takes skill to come up with a team’s draft list, but there is great consensus among the first couple of picks and large consensus about who should be in the top dozen picks. It’s only when the potential talent gets thinner that teams would differ greatly on who should be picked.
Is there any skill in sniping great talent late in the draft? The Calgary Flames selected TJ Brodie with the 114th pick in 2008, and that was an absolutely good pick.
Calgary was lucky with this pick, not skilled. If they thought he’d be the player he turned out to be, they should have drafted him with their 25th overall pick that year, or 48th, or 78th or 108th. Every time a late-round pick succeeds, it is a matter of luck for the drafting team.
Every. Single. Time.
Related Articles