
Every now and then one comes up with a plan that will take some time to come to fruition. That plan, this year, for me, is to do three progress reports on the players. In each article, I will highlight the players who have played the best to that point in the season.
I want to publish these articles as each quarter of the season goes by. That’s the plan, anyways. We’re essentially at the first quarter (2024 November 22), so here is the first report. Let’s start with the Top 50; the methodology will come next.
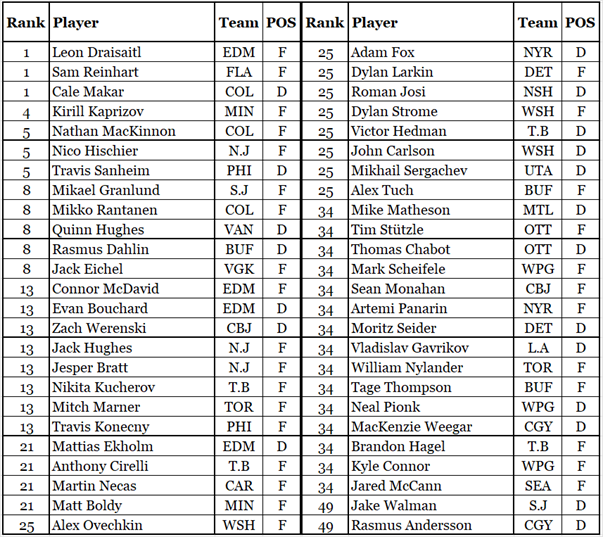
Top 50 Skaters After 20-ish Games
How Players Were Ranked
Players were ranked by Productivity Rating, specifically PR-Score. While the order of the players was determined by their detailed PR-Scores (four decimal places), their rank (first column) was based on PR-Scores rounded to the first decimal point. Leon Draisaitl (EDM, PR-Score 3.3434), Sam Reinhart (FLA, 3.2982) and Cale Makar (COL, 3.2867) all had rounded PR-Scores of 3.3, so they shared the #1 rank.
Distribution of PR-Scores
The following chart shows how the PR-Scores were distributed.
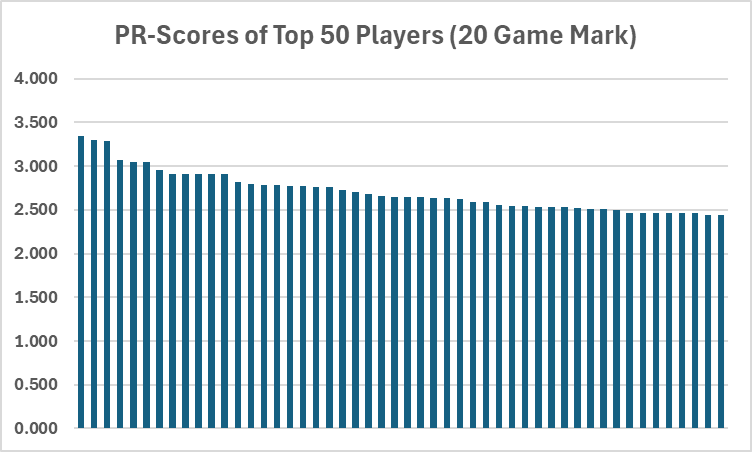
The top three (Draisaitl, Reinhart, Makar) are clear leaders of the pack. After about ten players the differences between their PR-Scores are very slight.
Distribution by Position
The top fifty contains 30 forwards and 20 defensemen. One of the goals for the PR formulas was to have defensemen make up about 40% of the top-ranked players. That this particular set of players had exactly 40% defensemen was a pleasing happenstance.
Distribution by Position
Edmonton and Tampa Bay each have four players in the top fifty. Buffalo, Colorado, New Jersey, Winnipeg and Washington each had three. Toronto has as many players on the list as Ottawa (two).
Dallas, with a team record of 12-6-0, had no players in the top fifty. Nashville, with a team record of 6-11-3, had one player on the list. Go figure.
But What About …
There are a couple of players who are conspicuous by their absence, players who were in the top 50 last season that aren’t in the top 50 right now. Let me talk a little about four of them.
Auston Matthews (TOR) – 2nd place last season, 119th place this season – Matthews has missed seven games so far. PR-Score is calculated on accumulated statistics (minutes played, for example) and not on descriptive statistics (time on ice per game played). When a player misses games he doesn’t accumulate statistics, and so his PR-Score stagnates.
Sidney Crosby (PIT) – 11th place last season, tied for 49th place this season – Crosby is not on the top 50 list, even though he is tied for 49th place. That’s because the order of the top fifty was based on a player’s PR-Score to four decimal places while his ranking was based on his PR-Score to one decimal place. Jake Walman’s (S.J) detailed PR-Score was 2.4453, Rasmus Andersson (CGY) was at 2.4435 and Sid the Kid was at 2.4330. In all, twelve players tied for 49th place.
J.T. Miller (VAN) – 12th place last season, tied 84th place this season – It’s not like he was playing poorly, he was just playing poorly for him. He’s now on indefinite leave. Stapled To The Bench wishes him well.
David Pastrnak – 13th place last season, tied 119th place this season – With 18 points (in 21 games) he is in the top 50 in the league in scoring. PR-Score evaluates players based on a number of statistics, and Pastrnak’s rating is hurt by three statistics: he has played only 18 seconds of Penalty Kill in 21 games; he has 38 giveaways; he has not been involved in many defensive zone faceoffs (18.5%; 71 of 383 total faceoffs). For context on his defensive zone faceoff data, the league average is 34% and the average of the top 50 players is 29%.
Many other players who were in the top fifty last year just haven’t hit full stride yet. Players will go through hot streaks and cold streaks in an 82-game season, and many players have not yet had their hot streak.
Almost Forgot The Goalies
My partner at Stapled To The Bench does the hard work: he converts my articles, which are written in Word, to an internet friendly format. I had sent this article to him so he could work his magic on it, and then realized I had forgotten about goalies. So I added this section and sheepishly sent him a second version.
Goalies will be rated by GxPts: Goalie Expected Points. GxPts is based on a goalie’s time on ice, his goals against and his expected goals against: all game situations are included. GxPts estimates how many points an average team would get with a specific goalie in nets based on the way he played. For more details, see the article listed in the Related Articles section.
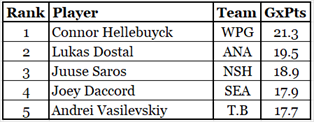
I showed GxPts for goalies because it is a number with appropriate context: it shows standing points based on the amount of time a goalie has played.
Dostal and Daccord are the surprises in this group. They rank 55th and 56th (respectively) based on their play over the last three seasons (2021-22 to 2023-24).
Hellebuyck, Saros and Vasilevskiy are among the top five goalies over the last three season. The “but what about” goalies are Igor Shesterkin (NYR – 3rd over the last three seasons, 8th this season) and 0Ilya Sorokin (NYI – was 4th and is now 18th).
Summary
One more point about Auston Matthews not being in the top 50 players at this point of the season: the ratings for 2024-25 are based solely on play in the 2024-25 season.
The fact that Matthews had a magnificent 2023-24 season does not help him in the slightest bit in the 2024-25 calculations. Similarly, a player with a lesser rating in 2023-24 (Martin Necas, for instance), is not hurt by his earlier season.
Related Articles