
I document the calculations performed for almost all of my statistics for two reasons: it allows readers to replicate my calculations and evaluate my processes.
The first reason lets you know that my ratings are correct with respect to the formulas. If I say Ned Braden (F, CHA) has a PR-Score of 7.5112, you can confirm that by doing the calculations yourself. It would help if you were handy at Excel, and you’d need to know where to get the source data from various NaturalStatTrick.com reports, but you could do it.
The second reason lets you evaluate whether my ratings are correct regarding ranking players. Of course, there can be quibbles with the formula, but overall, I hope the reader sees that the results are reasonable. No set of formulas would do things perfectly.
One Specific Aspect of My Approach to Rating Players
My goal is to rate all players fairly, so I use specific counts when converting a statistical value to several points. The option would be to assign points based on ranges: a player would get one point for each 10 goals scored, for instance. Let me show you why this approach is massively unfair to players.
The table below shows how many points a player would get based on the number of goals he scored, using ranges. A player who scored no goals would get zero points.
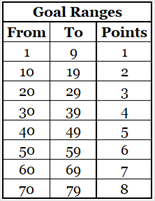
Now, using data from 2023-24, let me show you the goals scored by some players and the Points they would be awarded under this approach.
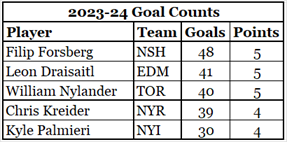
Draisaitl and Nylander are one goal apart, but both would get 5 Points. That’s slightly unfair.
Nylander and Krieder are one goal apart, but Nylander gets 5 points and Kreider gets 4 points. A one-goal gap in performance between two players generates different rewards. That is unfair.
Forsberg and Palmieri are EIGHTEEN goals apart, but Forsberg gets only 1 point extra. That is massively unfair.
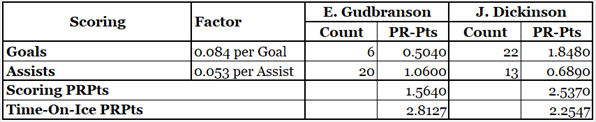
The fair approach is to reward players based on exactly how many goals they scored. As you will see later on in this article, Productivity Rating Method 2 (PR) gives players 0.084 Points for each goal they scored, the results of which are shown below.

Each player’s reward (PRPts: Productivity Rating Points) exactly reflects his goals scored. When players are one goal apart, their PRPts are 0.084 apart. Forsberg’s eighteen-goal advantage over Palmieri gives him 1.5120 more PRPts.
Using exact statistical counts to assign PRPts is far fairer than using ranges.
And now, it is time to go into the specific calculations. I’ll group together statistics that are logically connected. Calculation details will be presented using the data from two players based on their 2023-24 data: Erik Gudbranson (CBJ, D) and Jason Dickinson (CHI, F).
Each table will show the details of various components of PR as well as the total for that set of components. Subsequent tables will show the totals of the earlier-mentioned sets of components.
Time On Ice
I will stress one last time that all the data in this article comes from the 2023-24 seasons.
Time-on-ice is used three ways in the calculations. There is a reward for total time-on-ice (in all situations), there is a bonus for players who have more than 1,230 minutes of time-on-ice, and there is a reward for Penalty-Kill time-on-ice.
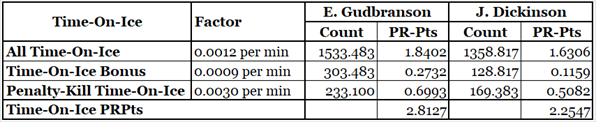
Why do I use 1,230 minutes as the bonus criterion? Because it represents 15 minutes per game over 82 games.
Scoring
When it comes to scoring, only goals and assists are used in the calculations.
No extra reward is given for goals scored during a powerplay, during a penalty-kill or in overtime. The game situation of a scored goal is also ignored: a player gets as many points for scoring the first goal of a 7-0 win as the player who scores the seventh goal in that game.
No reward at all is given for goals scored in the shoot-out.
No special consideration is given for players who score 30, 40, 50 or 92 goals. No special consideration is given to players who break Wayne Gretzky’s career record. A goal is a goal, and each goal is one goal.
Faceoffs
Readers of this article will be familiar with the faceoff win percentage (FOW%) statistic and may be distraught that I don’t use FOW% in PR. The reason I don’t use FOW% is that it is a rate statistic: a percentage. If I used it, I’d have to evaluate any player who won 50% of his faceoffs equally, whether he won one of two faceoffs or 618 of 1,236. That is not fair.
I use two faceoff count statistics: faceoffs taken and faceoffs won. A player who won one of two faceoffs will get a much lower reward than one who won 618 of 1,236.
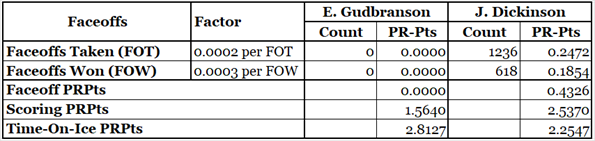
Obviously, including faceoffs provides some forwards with more PR-Points than defenseman, but that isn’t unfair, just as it isn’t unfair to defenseman that forwards who score a lot get more PR-Points.
Hits, Blocks, Takeaways and Giveaways
These four statistics count events that could lead to shot attempts or that could reduce the number of shot attempts the opponents get. Individually, each event isn’t worth much. The formulas are designed to deal with 82 games’ worth of data, and a player who does something repeatedly over the course of the season will accumulate a good count.
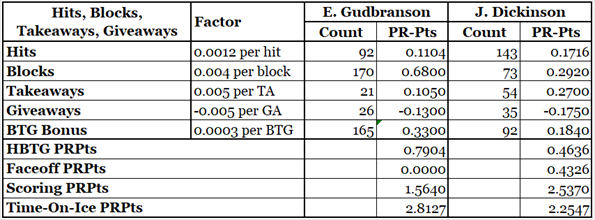
The ”BTG” bonus is meant to further reward players who had lots of takeaways and blocks compared to their giveaways. The BTG count is calculated by adding blocks to takeaways and then subtracting giveaways.
It is possible to get a negative BTG count, which results in negative PR-Points. David Pastrnak (BOS, F) had 19 blocked shots, 54 takeaways and 98 giveaways, resulting in a BTG count of -25 and -0.05 PR-Points.
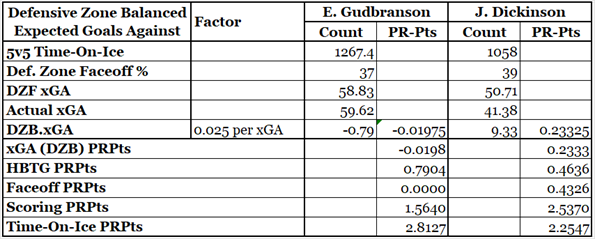
Expected Goals Against Balanced by Defensive Zone Starts
This was the big change in the productivity rating process. I wanted a component that reflected a player’s defensive contribution, which the new component does. The old component (Team-Relative Corsi) actually favoured offensive players.
There are two problems when it comes to quantifying a player’s defensive actions: one is that there are not many defensive statistics, and the other is that good defensive players are put on the ice in bad-for-them situations. Good defensive players get a lot of defensive zone faceoffs, which drives up the raw counts of the opponent’s offensive statistics.
Research I’ve done for other articles led to the creation of a table that translates a player’s Defensive Zone Start percentage to an estimate of expected Goals Against (xGA) he is likely to give up per 60 minutes of 5v5 ice-time.
Here are two examples from the table. A player who takes 22 defensive zone faceoffs per 100 faceoffs would be expected to give up 2.110 xGA per 60 minutes. A player who takes 42 defensive zone faceoffs per 100 faceoffs would be expected to give up 3.010 xGA per 60 minutes, almost one full expected goal more per 60 minutes (that is a huge difference).
This table is used to determine the xGA an “average” player would have in the same amount of 5v5 ice-time of the player, and the player’s reward is determined by the difference between his actual xGA and the “average” xGA.
This is where computers come in handy. The hard work is figuring out how to create the data needed for this calculation. Once that is done, all players get a copy of the formulas and the work to each player is done pretty much instantaneously.
The worst defensive player in 2023-24, based on this process, was Alex Ovechkin (WAS, F). Nobody wants him playing defense anyway. The best defensive player was Esa Lindell (DAL, D): a defenseman’s defenseman.
Defensive Zone Starts
Defensive zone starts indicate a player’s defensive skills, as recognized by his coach. Coaches will send out the better defensive players to take defensive zone faceoffs, and they’ll send Alex Ovechkin (WAS, F) out for offensive zone faceoffs. I often wonder if Alex Ovechkin’s defensive zone faceoffs provide a count of the number of times when he was on the ice and Washington was called for icing.
To get a number on which to assign PR-Points, a player’s defensive zone start count is multiplied by three and then his offensive and neutral zone starts are subtracted from it. A player who took 400 defensive zone faceoffs out of 1,000 total faceoffs will get more PR-Points than a player who took 4 defensive zone faceoffs out of 10 total faceoffs.
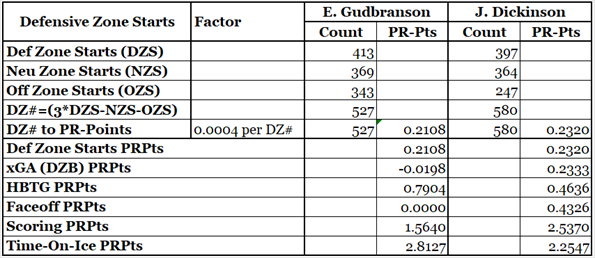
It is possible for a player to have a negative DZ#, which would result in negative PR-Pts. Artemi Panarin (NYR, F) had 115 defensive zone faceoffs out of his 894 total faceoffs, leading to -0.29 PR-Pts. Ovechkin was the second lowest in this component, followed by Alexis Lafrenière (NYR, F), Richard Rakell (PIT, F) and Thomas Novak (NSH, F).
The defenseman with the lowest DZS score was Sebastien Aho (NYI, D), who was on the ice for 693 faceoffs but only 155 in the defensive zone. It is not a good sign for a defenseman’s career if the coach refuses to use him in the defensive zone.
Defenseman and Player Bonuses
Much of what a defenseman does is untracked by statistics. When he’s in the right position and an opponent can’t shoot, that doesn’t get counted. When he retrieves a shot-in and gets the puck to a teammate, that isn’t counted (in freely available statistics). When he strategically, but not illegally, impedes an opponent, that doesn’t get counted.
To address both this statistical shortfall and my desire to have the top 100 players each year have about 40% defensemen, it is necessary to increase the PR-Score of defensemen. I decided to use their time-on-ice as the basis for their bonus: if a coach puts one defenseman on the ice more than another, he’s saying the one defenseman is more productive. I’m not going to argue a point like that with an NHL coach.
To ensure that all players have positive scores, I give each player a 0.5 PR-Pts bonus. Another goal of mine in creating this site was to never insult a player (not named Ryan Reaves), and giving a player a negative PR-Score would be insulting. After all, even the least effective NHL player is in the top 1,200 players in the world.
All the components that make up PR-Score have been described. The final step to producing a PR-Score is a simple addition.
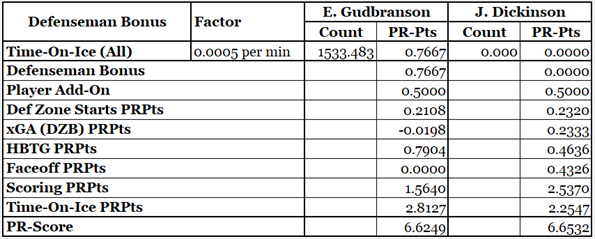
Both Gudbranson and Dickinson were in the PR-First5 category in 2023-24, and their PR-Scores were very close to each other.
Precision vs. Accuracy
Was Dickinson a better player than Gudbranson in 2023-24? Even though he had a very slightly higher PR-Score (0.0283 PR-Points higher), I would consider them as equals.
The question raises an important issue regarding precision and accuracy in Productivity Rating calculations.
PR-Scores are very precise: the same component data values will produce the same PR-Scores every time the data are processed, and they are calculated to four digits of precision. But all those decimal places could lead to an impression of accuracy that is unwarranted.
Accuracy refers to how close a measurement is to its true value, and this is a question which cannot be answered objectively. While the PR process cannot be proven to be accurate, its accuracy can be evaluated subjectively.
Are the right players rated highly? Is a player with a higher rating better than one with a lower rating? These questions were critical in the development of both PR methods: if a version of the formulas had said that Josh Morrissey (WPG, D) was the best player in the league, it would have been time for a refinement. If a version had said that Mason Appleton (WPG, F) was the best player in the league, it would have been time to start over.
To do the subjective evaluation, I will show sets of five players who either all play forward or all play defense. They will be presented in PR-Score order with regular gaps from player to player. The inter-player gaps will get smaller in subsequent tables.
I’ll begin with players separated by 2 PR-Points, which is the size of a PR-Category.
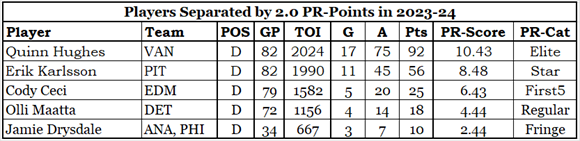
Job done! There is no question that these players are in the right order based solely on their play in the 2023-24 season.
PR is a one-season measurement: what a player has done in previous seasons is not considered. PR is a measure of what a player did in a season, not the value a player has (that’s what Value Rating does).
Now we’ll make the separations a little finer.
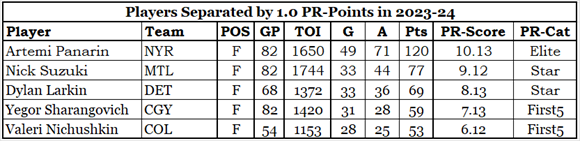
Job done! You may subjectively feel that Larkin was a better player than Suzuki, but PR looks at what a player did in the season. Larkin missed fourteen games, which lowered all of his statistics. While Larkin might have scored 40 goals had he played all 82 games, he is evaluated on the 33 goals he did score. His 2023-24 season is not as good as Suzuki’s because he didn’t play as much as Suzuki.
Interestingly, Larkin is rated higher than Sharangovich, who played fourteen more games than Larkin. These tables don’t show all of the data used to calculate PR-Scores. On top of Larkin’s offensive edge over Sharangovich (two goals, eight assists), Larkin took 950 more faceoffs and had better defensive data.
Let’s get the players standing closer together.
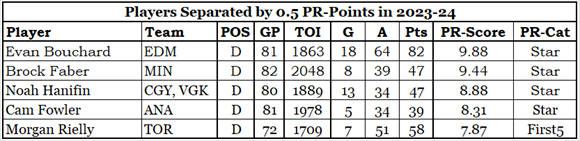
These players show how PR-Scores can be affected by factors other than scoring. Rielly had a 19-point advantage over Cam Fowler, yet is almost one-half PR-Point below him. The scoring advantage for Rielly is one full PR-Point (1.07, more precisely), so how did Fowler get a higher PR-Score?
He did it mostly through time-on-ice. Not only did he have a 270-minute advantage in all-time-on-ice, he had 220 more minutes of PK time. That time advantage more than offsets Rielly’s scoring advantage.
Fowler’s defensive numbers are also better than Rielly’s. On considering everything, Fowler’s half-point edge in PR-Score is obviously deserved.
Would Rielly have had a higher PR-Score if he had played 82 games? There is a two-fold answer to that: yes, obviously he would have had a higher score, and that doesn’t matter in the least. Rielly’s PR-Score reflects what he did in the 72 games he played and the 10 he didn’t play. PR reflects what a player did, not what he might have done.
Let’s get some players crowded together.
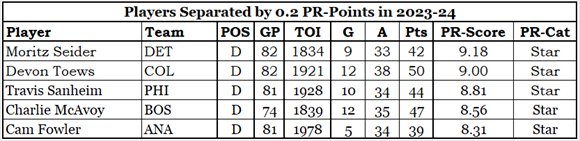
Cam Fowler makes a second appearance in these tables, solely because of a lack of defensemen in the PR-Score range of 8.41.
I would still say that the job has been done properly, but it isn’t a snap decision. Sanheim ranks above McAvoy because McAvoy missed games. Seider ranks above Toews due to defensive components.
Let’s get the players so close together that their shoulder pads are touching.

I can not say, in all honesty, that these players are perfectly sorted based on their productivity. Boeser and Barzal were both better than Marchand, but was Boeser really better than Barzal? Through the vagaries of the formulas, he rates higher.
Summary
I figured this would be one of the longer articles, as there are a lot of details, and I wanted to provide depth in the explanations.
The most interesting section to me was Precision vs. Accuracy. It is rather easy to take a bunch of disparate statistics, stick them in a blender of mathematical formulas, and thus produce a number. How do you have confidence that the number is a reasonable estimate of the productivity of a player? You can only do it subjectively, by comparing various players with different ratings.
When the ratings are far apart, 0.5 PR-Points and above, the Productivity Rating is clearly correct. It is only necessary to understand that PR rates what a player did in a season, so players who miss games will rank lower than you would expect them to.
When the ratings are 0.2 PR-Points apart, Productivity Rating is (to me) still correct, but it may take more than a second to confirm that. McAvoy (BOS, D) gets a lot more press in the Ottawa area than Sanheim (PHI, D), and familiarity with a good player breeds respect and expectations. My gut reaction is that McAvoy is a good defenseman who should rank higher than Sanheim: a closer look shows that McAvoy missed games and which lowered his PR.
When the ratings are very close, 0.02 PR-Points apart, the player order is more technical than it is accurate. Technically, Boeser has a higher rating than Barzal. Practically, they are equals.
At the end of a horse race, you can have two horses thundering down to the wire, nose by nose, their heads bobbing. The finish line is an arbitrary end to the race, and whichever horse’s head is further forward at that moment will determine the winner. It doesn’t mean the winning horse is actually and truly faster than the runner-up. But in that race, given the position of the cameras that took the picture for the photo finish, the winning horse won.
Related Articles