In order to evaluate teams on their success at drafting, it is necessary to have expectations of what they should have gotten from their draftees. A case in point is Mark Stone, who was a very pleasant surprise for Ottawa, given he was drafted 178th in 2010. Truth be told, he would have been considered a disappointment had he been drafted 8th.
This article will show how the value of a draft pick was determined. A different method is being used than has been previously used.
All players are evaluated based on the six seasons immediately after the year they are drafted. When I say something like a player did not play in the NHL in this article, I mean he did not play in the NHL in his first six post-draft seasons.
A Minor Change
It is a minor but necessary change. In earlier articles, I used a Stapled To The Bench (STTB) statistic called Return From Play (RFP$), which converted a player’s PR-Score to salary dollars: the better the season, the higher the RFP$.
RFP$ was based on an $82MM (MM = million) salary cap. With the salary cap set to explode these next few seasons, it was clear that RFP$ would have to change as well. A season worth $6MM in 2020 might be worth $9MM in 2026, given the estimated salary cap increases.
What is constant from season to season is PR-Scores. A season that produced a PR-Score of 8.22 in 2007 would produce a PR-Score of 8.22 in 2026. Rather than convert PR-Scores to RFP$, I will simply use PR-Scores.
How Drafted Players Are Evaluated
Drafted players will be evaluated by their total PR-Score in their first six post-draft seasons. The time span was chosen because a team should be able to control the drafted player for at least that long.
It’s time for examples, so let’s check Travis Hamonic, a defenseman drafted with the 53rd pick in 2008 by the New York Islanders. He played in Ottawa in 2024-25.
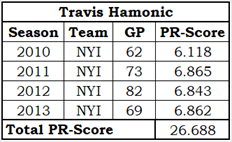
Hamonic did not play in his first two seasons, so they count for naught. He played very well in the next four seasons and accumulated a total PR-Score of 26.7. To get an idea as to whether that is a good total PR-Score, we need five more Travises.
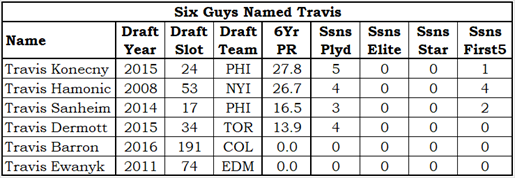
(In the column headers, Ssns means seasons.) Hamonic’s total PR-Score is just under Konecny’s, who played an extra season. Sanheim and Dermott are close to each other in total PR-Score: Sanheim took a little while to develop and is obviously the better player. Neither Barron nor Ewanyk played even a single NHL game.
Draft Groups
The first step in determining the value of a draft pick will be to group picks together: there is no difference in what you would expect from the 102nd pick and the 103rd pick. The groups are shown in the table below.
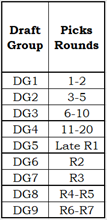
A small change has been made to the draft groups I used in earlier articles, and I’m surprised it took me so long to extract my head from my [body part] to figure it out.
The change starts in group 5. In the earlier approach, I was focusing on groups of 30 draftees, as the 2007 draft involved 30 teams. Things started getting messy when the league expanded, and messier when it expanded again. The new approach will use draft picks to identify the first four groups, the fifth group will be the rest of the first round, and the last four groups will be defined by rounds.
While these groupings are somewhat arbitrary, you will see that they work. The better players are usually drafted with early first-round picks and the projects are usually drafted in the later rounds.
Draftees
The next step is to determine how many skaters were drafted in those groups from the 2007 to 2019 drafts. 2019 is the latest draft class that can be evaluated, as it is now six seasons since that draft was conducted.
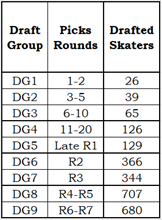
Two important details about the counts of drafted skaters: goalies are excluded, and players who never made it to the NHL are included.
Goalies are excluded because they are evaluated using the STTB statistic Goalie Expected Points (GxPts), and there is a process that converts GxPts to PR-Scores.
Players who never made it to the NHL are included because they are a key portion of the drafted skater population. If calculations were based solely on the players who played in the NHL, the value of draft picks would be unrealistically high. Just as the value of lottery tickets would be too high if you based your calculations only on winning tickets.
The Value of a Draft Pick
First up, I calculated the total PR-Score of each drafted player. (Travis Hamonic’s total PR-Score was 26.7). I then calculated the totals for each draft group (Hamonic was in DG6, the group of players drafted in the second round). The results for all nine groups are:
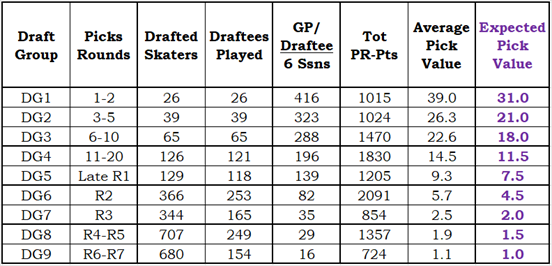
Along with the Expected Pick Value, this table contains some interesting trivia. Draftees played shows the number of drafted skaters who played at least one NHL game. Draft Group 4 (DG4, picks 11 to 20 of the first round) is the first group that drafted skaters who did not play in the NHL. Column 5, GP/Draftee, shows the average number of games played by draft skaters. Skaters drafted after the fifth round (DG9) average playing a total of 16 NHL games.
Average Pick Value is the result of dividing Total PR-Points by Drafted Skaters, and Expected Pick Value is 80% of the Average Pick Value, rounded to the nearest 0.5. The 26 draftees in DG1 produced a total of 1015 PR-Points, which is an average of 39.0 PR-Points per draftee, and 80% of 39.0 PR-Points is 31.0 PR-Points.
The reason Expected Pick Value is lower than Average Pick Value is completely logical: the draft is a profitable undertaking for teams, and that should be reflected in these data. After all, if teams didn’t improve through the draft, they wouldn’t participate in the draft. Using 80% was an arbitrary decision.
This table lays the foundation for evaluating teams in how they draft. I’ll finish the article with some trivia about the draftees. Only one table comes with commentary: you’re welcome.
Best Player in Each Draft Group

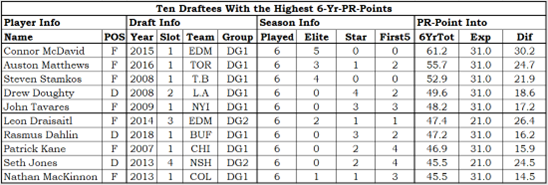
Top Ten Draftees (Based on 6-Year PR-Score)

Highest Return (6YrTot – Exp)
The Value of a Late Round Draft Pick

You know how people will sometimes say things that drive you insane because, you know they are wrong, and you know they won’t believe you if you argue about it? One of the many things that triggers this reaction in me is when somebody says that a player like Mark Stone is an example of the value a team can get late in the draft. When Ottawa drafted Eerik Wallenius with the 136th overall pick in the 2024 draft, I bet some hometown commentator brought up Mark Stone as a comparison, implying that Stone’s result was a reasonable expectation for Wallenius.
No, Mark Stone isn’t an example of the value you can get late in the draft. He and the other players in the table above are unicorns. They produced far more than could reasonably have been expected from players drafted in the sixth or seventh round. The people who bring up Mark Stone suffer from selection bias: Mark Stone does not truly represent the target population of players drafted in the 6th and 7th rounds.
Honestly, it is exactly like saying that Connor McDavid is an example of the value a forward can bring to his team. Drives me crazy, it does.
Summary
Because a bunch of lawyers in Vegas couldn’t figure out the contract status of Evgenii Dadonov, Ottawa was penalized a first-round draft pick. That penalty will be enforced this draft, costing Ottawa the 21st overall pick. What sort of player are they missing out on?
The 21st pick is the first pick in Draft Group 5. I guess that the estimated Draft Value for the 21st pick is 9.5 PR-Points, as DG5’s Draft Value of 7.5 is the average of picks 21 through 32.
There are several players who were selected with a pick in the 20th to 25th overall draft slot who had a PR-Score is around 9.5 in their six post-draft years. I’ll use Kevin Hayes as the example of the contribution such a player makes. Hayes was drafted in 2010 with the 24th overall pick and took four years to mature before playing in the NHL. His Career PR Chart (to 2015-16) is below.
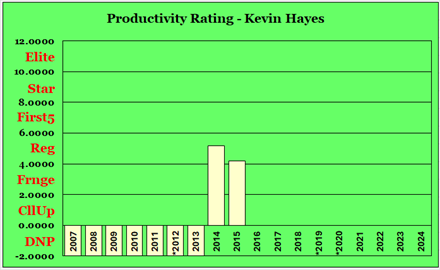
Based on this example, Ottawa is missing out on a player who would be a fourth-line forward in 2029-30 and 2031-32. In fairness, Hayes was a good player from 2016-17 to 2022-23.
The Senator player whose productivity over the last two seasons comes closest to 9.5 PR-Points is Shane Pinto (9.8 PR-Points). Another way of looking at the player is that, five years from now, Ottawa will be missing out on the services of a forward who is not quite as good as Shane Pinto. Actually, he wouldn’t be anywhere near as good as Pinto, as Pinto’s PR-Point total is low due to his being suspended for half a season in 2023-24. It is not a huge penalty.
Related Articles
2025 Update – Draft Class Ratings
