
Stapled To The Bench (STTB) has never used data from playoff games. When the Productivity Rating formulas were being developed, I found that adding playoff data to regular season data unjustifiably inflated the ratings of players whose teams made deep playoff runs. A third-line forward would get the same (or better) rating as a second-line forward from a non-playoff team, and the only difference between them was that the third-line forward played more games. So, I said farewell to playoff data.
Playoff games are different than regular-season games. All you have to do to know that is watch a couple of playoff games. Some of the differences, like the intensity of games, are not measurable. But some of the differences are measurable, and hence we come to this article.
I will look for ways in which playoff hockey is measurably different from regular-season hockey. Some myths will be challenged along the way.
When This Article Was Written
This article was written in July and August 2025.
Myths To Be Challenged
In the playoffs, defensive hockey is more prevalent. It is said that there’s always a man back, you don’t let your opponents get odd-man rushes, and you don’t let them get rebound shots.
In the playoffs, home-ice advantage is important. You play all season to have the home-ice advantage in a game seven.
In the playoffs, there is more hitting. It’s all about sending messages; it’s all about making the other team pay whenever possible.
Regular Season Games that Will be Used as a Comparison
The single biggest difference between regular-season games and playoff games is the quality of the teams playing. Not to be mean, but Chicago and San Jose didn’t play any playoff games this season.
There are significant differences in regular-season games based on the quality of the teams that are playing in the game. The following table shows data from the regular season based on the types of teams playing in each game. “PO” means playoff team, and “xP” means not-playoff team. The data is for the away team (in PO at xP, the data reflects the PO teams).
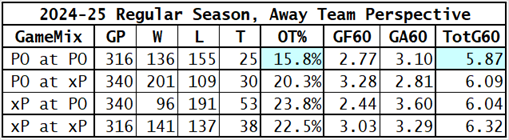
Two data cells were highlighted: OT% and TotG60 for PO at PO games.
OT% is the percentage of games that went into overtime. Two PO teams playing each other (PO at PO) got to overtime less frequently than in any other type of game. I found that surprising. The only reason I can think that might have happened, and this is an extremely subjective opinion, is that the leading team late in a PO at the PO game was much more tenacious at holding their lead. Not only did they not want the other PO team to get a single point, but they also didn’t want to risk losing their two points for a win by going to overtime, where the second point was basically a toss-up. Against an xP team, they might have thought that if they gave up the tying goal, they would just win the game in OT. That opinion may be more than subjective: it could be imaginary.
TotG60 is the total goals scored per 60 minutes. Games between two PO teams were lower-scoring affairs than games that had only one PO team, and much lower scoring than games between two xP teams. The reason xP vs xP games are higher scoring is that xP teams are less capable at playing defense, rather than being more capable at playing offense.
To make the regular season to playoff comparisons as fair and as meaningful as possible, I will compare playoff statistics to the regular season statistics that come from games where two playoff teams played each other, wherever possible.
The first myth to be investigated is that playoff hockey is more defensive in nature than regular-season hockey. Three sets of data will be used in this investigation.
Regular Season vs Playoffs – Pace of Play
Pace of play will be measured by Corsi, which is a count of all shot attempts taken. A wrist shot from the blue line is one Corsi, as is a shot taken from three feet in front of the net. Not all Corsi are equal.
Column headers in these next three tables identify the statistic (C for Corsi in this case) and whether that column shows values for the away team (A), the home team (H) or the total (T). All values shown are at the per-game level.
The three data rows show: values from regular season games between two eventual playoff teams; values from playoff games; and the percent increase or decrease in playoff game values over regular season game values.
To guide you through the first data row, in a regular season game between two eventual playoff teams, the away team had 57.7 Corsi, the home team had 59.8 Corsi, for a total of 117.5 Corsi.
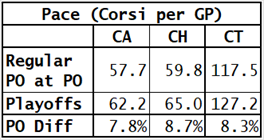
When it comes to shot attempts per game, there are more in the playoffs than in the regular season.
Regular Season vs Playoffs – Level of Offense
The level of offense will be measured using expected goals, a statistic which reflects both the quantity and quality of shot attempts. Going back to the examples from last section, the shot from three feet in front of the net is worth much more than a shot from the point. The symbol for expected goals is xG.
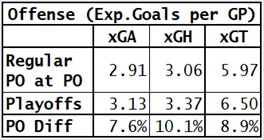
When it comes to expected goals per game, there are more in the playoffs than in the regular season.
Regular Season vs Playoffs – Scoring
Scoring will be measured by goals (like duh, obviously). And, also obviously, a goal is a goal is a goal (paraphrasing “Sacred Emily”, a Gertrude Stein poem from 1913).
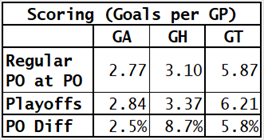
When it comes to goals per game, there are more in the playoffs than in the regular season.
Playoff Myth Evaluation – Playoff Hockey is More Defensive
According to the tables in the previous three sections, there is more offense in playoff games than in regular season games: more Corsi, more expected goals, more goals.
Now, if you have bought into the “defense is paramount in playoffs” idea, you’ll be looking for something that explains why defense is more important in the playoffs, even though offense has increased in the playoffs.
The table values represent “per game” totals, and playoff games have overtime, which means they are longer than regular-season games. Are the values simply a reflection of the increased length of the games?
Nope. Regular season games have overtime as well. The average length of a regular-season game between two eventual playoff teams was 60.49 minutes. The average length of a playoff game was 63.17 minutes. That is a difference of 4.4%, and almost all of the statistics were 7% or more higher in the playoffs.
The data show that playoff hockey is more offensive in nature than regular-season hockey.
Playoff myth: busted.
Playoff Myth Evaluation – Home-Ice Advantage is Important in the Playoffs
Whether you look at regular-season games or playoff games, if you have data from enough games, you will see that the home team has an advantage. Home teams get more Corsi, get more expected goals, get more goals and win more games.
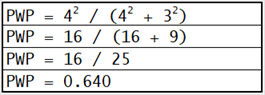
The question for me is whether home-ice advantage is more important in the playoffs than it is in the regular season. To determine this, I will look at the Pythagorean Win-Percentage for pace of play, level of offense and scoring. Pythagorean Win-Percentage is based on the squares of statistics. If a team’s average game score was 4-3, its Pythagorean Win-Percentage would be .640, as shown below
Pythagorean Win-Percentage has proven to be a very accurate estimate for Major League Baseball games, and STTB has a version that is very accurate for hockey. A hockey version is needed for regular-season games, as overtime losses contribute to a team’s points.
Pythagorean Win-Percentages (PWP) can be based on any statistic that is directly related to scoring, and the three categories that were used in this article are directly related to scoring: Corsi, expected goals and goals. I wouldn’t use PWP for statistics like faceoffs and takeaways.
With that background, let’s look at the home-team PWP in the various categories during the regular season and in the playoffs.
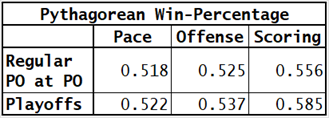
Home-team advantages in playoff games are higher than in the regular season, whether looking at pace of play, offense or scoring.
Home-ice advantage played a bigger role in the playoffs than in the regular season.
Playoff myth: confirmed.
Regular Season vs Playoffs – TakeAways, GiveAways, Hits and Blocked Shots
My data source, naturalstattrick.com (NST), has player-level data and team-level data. This article’s focus is at the team level, and unfortunately, NST does not provide several statistics in their team level reports: GiveAways (GvA), TakeAways (TkA), Hits (HIT) and Blocked Shots (BLK).
Those statistics are only provided at the player level, but the player-level data can be used to determine those statistics at the team level (all the hits delivered by Ryan Reaves can be credited to Toronto). It is possible to configure those reports so that there are separate lines for players who were traded during the season, one for each team they played on.
What is lost in this set of reports is the game-by-game counts. I cannot get these four statistics from just the games where two eventual playoff teams played each other. What I can do is get the data for each team and see if the differences between playoff teams and non-playoff teams are important.
In the following table, all statistics are per 250 minutes of ice time. The raw counts came from 5v5 play, and the average game has about 50 minutes of 5v5 play, which totals to 250 minutes played by those five players.
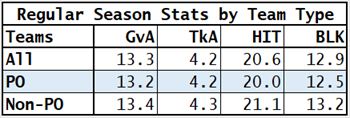
The differences between playoff and non-playoff teams are either trivial or small (HIT and BLK are about 5% different).
In my opinion, the reason non-playoff teams record more hits is that they are more frequently behind in their games. Generally, losing leads to hitting rather than hitting leads to winning. In a similar vein, non-playoff teams record more blocked shots because their opponents take more shots.
While the differences are small, I have regular-season data for playoff-bound teams, so I may as well use that as my comparison point. Playoff statistics are also based on 250 minutes of 5v5 play.
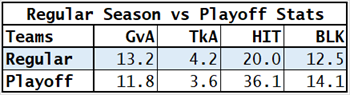
The differences can be summarized as three being in the non-trivial category and one being in the massive category. The difference in GiveAways and TakeAways could be explained by teams being “more careful with the puck” in the playoffs, and the increase in blocked shots could be explained by players making more of an effort to block shots in the playoffs.
On the other hand, these are “opportunity” statistics. To block a shot, the other team must have taken a shot; to give the puck away, you must have had the puck. The decrease in giveaways and takeaways could be related to teams having the puck less frequently in the playoffs than they did in the regular season. The increase in blocked shots could be partially explained by the increase in shot attempts in the playoffs.
There is only one thing that can reasonably explain the huge increase in hits: there is a huge increase in hits (80%) in the playoffs.
Playoff Myth Evaluation – There is More Hitting in the Playoffs
Playoff myth: confirmed. Not exactly a ground-breaking result.
Why does hitting increase in the playoffs? As usual, STTB will cop out and state that the data does not have context. It reflects what happened, not why it happened.
Here are some subjective guesses. Hitting increases: because referees call fewer penalties in the playoffs (so there is less risk of the hitter getting tagged with a penalty); because a hit might produce a retaliation penalty; because teams believe that hitting provides them with a strategic advantage in a seven-game series.
That last guess can raise questions that get progressively uglier. What would be the game-to-game advantage of increased hitting? Your opponents get worn down. How do they get worn down from hitting? They sustain injuries from being hit. Are teams trying to injure opponents? Well, that is the ugly question, isn’t it? Do two players in a fight try to injure each other? Of course they do. It is incredulous to think that they are hitting each other in the head but are being careful about causing concussions.
Summary
The “myth-busting” portions of this article are based on the TV show MythBusters.
Based on data, defense is not of paramount importance in playoff games.
Based on data, home-ice advantage plays a bigger role in the playoffs than it did in the regular season.
Based on data, hitting increases in the playoffs, and it increases massively.
Related Articles
None