
We here at Stapled To The Bench (STTB) are fascinated with the interplay of hockey statistics and age. Recently I wondered whether a player’s faceoff skills declined with age.
To clarify, I should say I wondered when a player’s faceoff skills declined, as the fact that they will decrease is as inevitable as cold temperatures in winter. Let us look at the data.
When This Article Was Written
This article was written in late September 2025.
Centers Rather Than Forwards; Centers with a Future
To ensure that the data being analyzed was based on players who took a lot of faceoffs, only seasons where a player took at least 492 faceoffs were included. The number 492 comes from 6 faceoffs per game over 82 games. In 2020-21, Curtis Lazar (BOS, BUF) was involved in 490 faceoffs in the 73 games he played, so he did not qualify for inclusion.
Another criterion was that the season in question had to have a possible subsequent season to qualify. Sidney Crosby took 1,782 faceoffs in 2024-25, and that season was not included in the analysis. Don’t feel sorry for Sidney: he qualified in sixteen other seasons (every season from 2007-08 to 2023-24 except for his injury-riddled 2011-12 season).
How Faceoff Prowess and Aging Will Be Measured
Before I started the analysis, I planned to look at two faceoff statistics: faceoff winning percentage (FOW%) and number of faceoffs taken (FOT). As I began the analysis, I was reminded why I dislike percentages: a player with relatively few faceoffs taken can have a large faceoff winning percentage (a player who won 6 of 8 faceoffs won 75% of his faceoffs). While those FOW% values were precisely correct (6/8 = 75%), they were far from accurate (6 faceoff wins over an 82-game season is nothing). There will be a little more explanation a couple of paragraphs from now.
Another problem was that the chart I was planning to use turned out to be unsatisfactory. It was a “combo chart” with both lines and columns and, frankly, was a little misleading.
I changed tack and based the analysis on faceoffs won per game played (FOWGP). While it is a rate statistic rather than a count statistic, in my opinion, it is a much better rate statistic than is FOW%.
To record the impact of aging on the ability to win faceoffs, I compared a player’s FOWGP in consecutive seasons. If a player increased his FOWGP by at least 1.5, that was categorized as a “U” (Up) transition; a player whose FOWGP decreased by 1.5 or more was categorized as a “D” (Down) transition; a player whose subsequent FOWGP was within 1.5 of the previous FOWGP was categorized as an “S” (Same) transition; a player who didn’t play or didn’t take many faceoffs in a subsequent season was categorized as an “X” (Not a center) transition.
Too many words, not enough clearly organized numbers! Here are four examples of players, one for each type of transition.
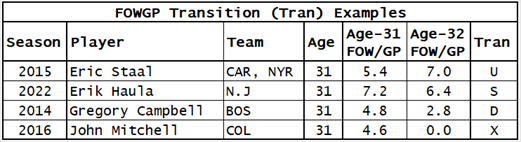
Back to FOW%: it was a big issue for me when I tried to compare FOW% from a qualifying season to FOW% in a subsequent season when the player involved barely took any faceoffs in the subsequent season. A player could go from 48% (based on 1,000 faceoffs) to 75% (based on eight faceoffs) and look like he’d made a huge improvement even though he no longer took faceoffs.
Back to FOWGP: the next step was to count the USDX transitions by player age, and the final step was to use 3-year age groups. It may not be obvious, but players age at different rates. No, that’s not quite right: all players age at the rate of one year per year. What I mean is that the impact of aging hits players at different ages: some guys start declining at age 25, some guys maintain their skill levels well into their thirties. Knowing that a precise pivot age did not exist (you could not say that all centers start to decline at age 31), the use of age groups shows the impact of aging without getting bogged down in details.
Age Group Counts
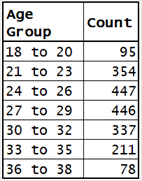
The counts of players in the various age groups tell us something about how centers are used.
In seventeen seasons, only 95 players younger than 21 were allowed to take at least 492 faceoffs. Is this a result of coaches thinking that young players are not good at faceoffs? No, it is a result of young players not being good at faceoffs. Those 95 players won only 46% of their faceoffs.
The age group with the highest FOW% (53%) is the 36 to 38 group. This is a great example of survivor bias: the group has only 78 players because older players who do not win a lot of faceoffs do not get to take a lot of faceoffs. It is also a great example of how high-skill players differ from moderate-skill players, in that their skills decline more slowly.
A total of 1,968 player-seasons qualified for analysis: seasons between 2007-08 and 2023-24 where a player aged between 18 and 38 inclusively took a minimum of 492 faceoffs.
Faceoffs and Aging
In the following “stacked column” chart, four colours are used to show the frequencies of “transitions” after a qualifying season.
In each column, the green rectangle represents U transitions (a rise of 1.5 or more FOWGP), yellow rectangles represent S transitions (within 1.5 FOWGP), red rectangles represent D transitions (a drop of 1.5 or more FOWGP), and he black rectangles represent X transitions (qualifying seasons that were followed by a player not taking a lot of faceoffs).
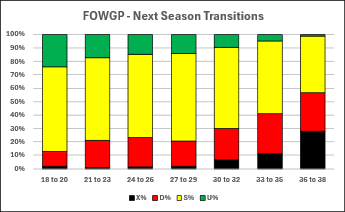
Early in a career, centers tend to improve or maintain their faceoff skills: the first two columns have the biggest green sections and the smallest red sections. From ages 24 through 29, players tend to maintain their faceoff skills.
Faceoff skills start declining in the 30 to 32 age group. Red and black portions of the rightmost three columns are bigger, while the yellow section gets smaller and the green section practically vanishes.
Summary
Skill deterioration for NHL players is a variable process. Specific players will begin deteriorating at different ages. For most players, a decline in faceoff skills will begin in the 30 to 32 age group. As with every other skill, those with the highest skill levels will start their decline later.
Coaches generally react to a player’s loss of faceoff skills by reducing the number of faceoffs a player takes. The first step is to have a center only take faceoffs on one side of the ice, his dominant side. The player will maintain a good faceoff winning percentage while winning fewer faceoffs: that’s why FOWGP is a much better measure than FOW% for this study.
Related Articles
None.