
It seems as though my Center Rating statistic (CR) changes as frequently as does my method for preparing salmon for our evening meal. We have salmon about 40 times a year.
Sometimes the differences in my preparations are subtle: I’ll take a spice rub I’ve used before and substitute allspice for nutmeg. Sometimes the differences are massive: I’ll take a completely different approach to preparing salmon (coated in cheese, wrapped in prosciutto, marinated in red wine, butterflied).
And so it is with CR: I took a look at what it was and saw that changes were necessary.
When This Article Was Written
This article was written in February 2026.
Making Changes
CR3 is largely a minor variation. Metaphorically, I’m swapping two spices and changing the measurement ratio. There is one reason and a related driving factor for changing CR.
A little while ago, I changed the Productivity Rating method (see related article, if you wish). That resulted in a change to the data structure used at Stapled To The Bench (STTB), and that change eliminated a statistic I used to do CR calculations.
If I had no plans to rate Centers again, I wouldn’t have had to worry about anything. But I did have plans to rate Centers again, for the end-of-season team-level articles. As I didn’t have the data for the old method, a new method was needed, and I also had to recalculate CR back to the 2007-08 season (so that career CR calculations could be made).
Descriptive Statistics vs. Counted Statistics
While STTB rarely uses descriptive statistics in its evaluation process, it uses them for CR because they are more appropriate. A player is rated on his having won 10.9 faceoffs per game rather than for having won 580 faceoffs over the course of the season.
If counts were used, a player who missed games would be unfairly penalized. A player such as the one who won 580 faceoffs (Aleksander Barkov, FLA, 67 games played).
To ensure that one-game wonders are not identified as #1 centers, two criteria for qualifying for a Center Rating were established: a player must have played at least 50 games in a season, and he must have taken at least three faceoffs per game played.
The games played requirement was elegantly handled for seasons shortened by lockouts and pandemics.
What Makes a Center a Number One Center?
At the heart of any rating system is the desire to properly rate and rank players, based solely on their statistics. What statistics can be used to differentiate a #1 center from a #2 center?
To answer that question, we need a number of statements on the qualities of a #1 center, statements that start with the phrase “a good center”. Also, the statement must lead to a number which can be used in the calculations. You won’t see a statement such as “a good center is good in the locker room.”
CR3: Scores and Categories
The selected statistics will be put into a formula that produces a single number, CR3-Score, that is (usually) between 100 and 900.
Unusually for me, I am not going to release the specific formulas used to calculate CR3-Score. They are a little complicated and it would take several pages, and I’m pretty sure that 99% of readers would just skip over the details anyway. If you really want to know, ask and I’ll send you the details.
Players will be put into one of four CR3 categories based their CR3-Scores. A CR3-Score above 550 puts a player in the CR#1 category, which is a #1 center. CR3-Scores between 400 and 550 put a player in the CR#2 category, and CR3-Scores between 250 and 400 put a player in the CR#3 category. Players with a CR3-Score below 250 are uncategorized (which is, pedantically, a fourth category).
Many of the uncategorized players are not really centers, they just took faceoffs when the actual center on their line was waved out or when an actual center was injured.
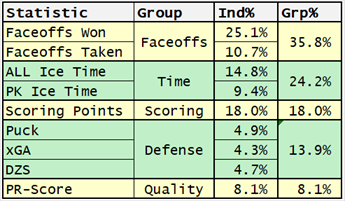
Qualities of a Center: Winning and Taking Faceoffs (35%)
The bracketed percent value in the section header indicates how much a quality contributes to CR3-Score.
A good center both wins a lot of faceoffs (FOW/GP) and takes a lot of faceoffs (FOT/GP).
The winning of faceoffs is much more heavily weighted in CR3 than in earlier Center Rating variations. FOW/GP accounts for 25%, FOT/GP accounts for 10%.
While faceoff winning percentage (FO%) is a descriptive statistic, it is not used in CR3. This is because there is no difference in FO% between a player who wins 10 of 18 faceoffs per game and one who wins 5 of 9 faceoffs per game. Both players won 55.6% of their faceoffs, but only one of them took the number of faceoffs a #1 center is expected to take.
A center is not penalized for losing faceoffs. Consider the two players in the following table.
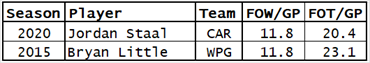
Bryan Little got a few more CR3-Points (CR3-Score’s unit of measurement is CR3-Points, because I said so) than Jordan Staal. Both players won faceoffs at the same frequency (11.8 per game), but Little was used more frequently for taking faceoffs (20.4, 23.1). This resulted in Little getting a higher CR3-Score, while Staal had a better faceoff winning percentage (58% vs 51%).
Is this fair to Staal? My answer is that the process may not reward Staal perfectly, but the process evaluates players fairly based on the qualities that were established. The qualities are winning faceoffs and taking faceoffs: “not losing faceoffs” was not picked as a quality.
Had Little and Staal played for the same team, Little would have sent out to take faceoffs less frequently. But Little’s competition for faceoff duties on his team wasn’t Staal. It was Mark Scheifele (FO% of 44%), Adam Lowry (46%) and Alexander Bermitsov (40%). Little took lots of faceoffs because he was the best player at winning faceoffs on Winnipeg in 2015-16.
Qualities of a Center: Time on Ice (25%)
A good center plays a lot, both overall (TOI/GP) and on the penalty kill (PKT/GP).
In CR3, players are rewarded for their overall ice time and for their penalty killing ice time. In total, these two statistics account for about 25% of CR3-Score.
TOI/GP accounts for 15% of CR3-Score and PKT/GP accounts for 10%. While PKT/GP is a time statistic, it is used in CR3 to reward centers that play defense.
Qualities of a Center: Scoring (18%)
A good center scores a lot. Specifically, he gets a lot of points (Pts/GP) rather than scores a lot of goals.
Scoring accounts for about 18% of CR3-Score.
Does this mean a low-scoring, defense-first player cannot be a #1 center?
No, it doesn’t. It happens, but it doesn’t happen a lot. Between 2007 and 2024 there have been thirteen players who rated as a #1 center while scoring less than 0.5 points per game played. In 2024-25, Mikael Backland (CGY) was a #1 center even though he had only 32 points in 76 games played.
Qualities of a Center: Defense (14%)
A good center is good defensively. In CR3 there are four measures meant to evaluate a player’s defensive skills. One is PKT/GP, already noted in the time-on-ice section. The other three are: “Puck”; situational expected goals against, and; defensive zone faceoffs.
“Puck” is a combination of giveaways, takeaways and blocked shots. A good center has a positive value when these three statistics are added together.
Situational expected goals against is a measure of the expected goals against a player is on the ice for based on the frequency with which he is on the ice for defensive zone faceoffs. The more frequently you take defensive zone faceoffs, the higher your expected goals against number should be.
Consider two centers who have vastly different roles: Player 1 is used frequently for defensive zone faceoffs; Player 2 is an offensive player. Their expected goals against per 60 minutes, based on their faceoff location mix, are quite different. In the table below, while Player 1 has a higher actual xGA, he is recognized as a better defensive player because he is compared with his situational xGA, not with Player 2’s actual xGA.
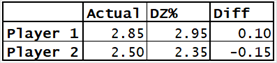
Finally, a player who is on the ice for a lot of defensive zone faceoffs (Player 1 above) is rewarded more than is a player who is rarely on for defensive zone faceoffs (Player 2).
In total, these three categories account for 14% of CR3-Score.
Qualities of a Center: Good Player (8%)
A good center is a good player. STTB uses Productivity Rating as the number which represents how good a player is.
A player’s talent level accounts for 8% of CR3-Score.
Even though PR-Score accounts for only 8% of CR3-Score, 57 of 66 PR-Elite players who qualified for CR were classified as #1 centers. The other 9 were classified as #2 centers.
PR-Score does not provide an unfair advantage for Elite players when their CR-Score is calculated. They get a high CR-Score for the same reason they get a high PR-Score: their overall statistics are extremely good.
Review of CR3 Statistics (Individually and Grouped)
CR3: The Proof of the Pudding
The Proof of the pudding is in the eating, as they say. With respect to a rating system, this means that the objective process (the CR3 calculations) can only proven correct through subjective evaluation: are the correct players identified as #1 centers?
Let’s start off at the top, according to CR3. From 2007 through 2024, the best center in the league has been Anze Kopitar (L.A.). His career CR3 chart is below.
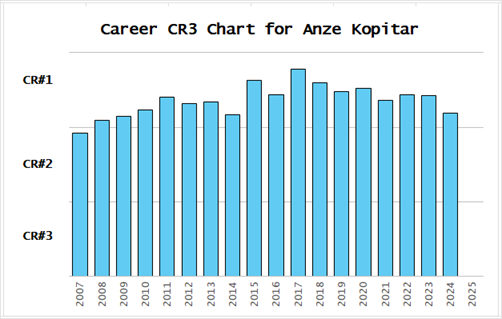
How about Sid the Kid?
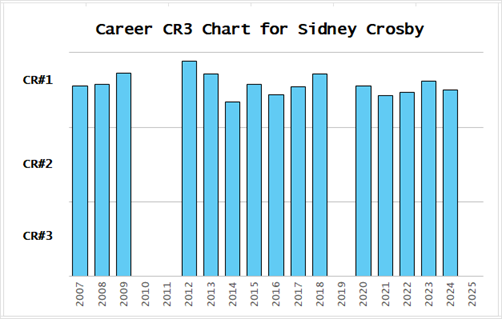
Crosby’s missing columns were caused by injuries: he missed the minimum games played requirement for CR3 in those seasons. Do you remember when there was great concern about Crosby’s future due to repeated injuries, back in 2011? Pepperidge Farm remembers.
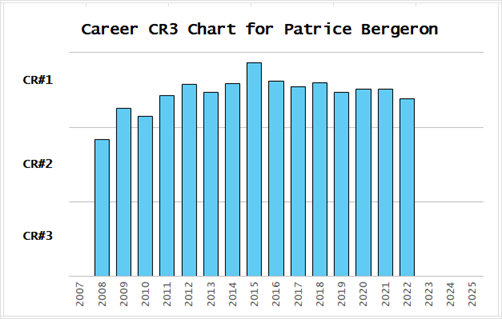
Patrice Bergeron is another player people would subjectively identify as a #1 center, and CR3 agrees. It is satisfying when an objective process agrees with subjective opinions.
Ryan O’Reilly (multiple teams) was undoubtedly a #1 center for a long period.
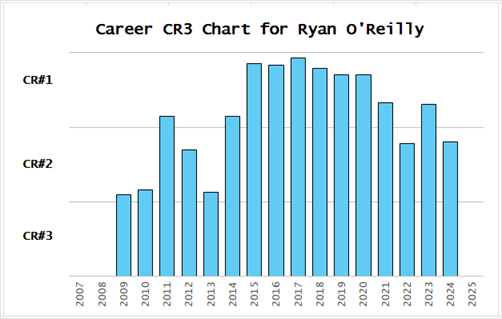
O’Reilly’s Career CR3 chart is much more hill-shaped than other top-level centers. A player generally reaches a peak level of skill as a center quickly and doesn’t lose that skill as rapidly as other skills decline late in his career. The reason for O’Reilly’s low CR3-Scores from 2009-10 through 2014-15 was that he was a young player playing on teams that had Paul Stastny and Matt Duchene. He moved to Buffalo in 2015-16 and was immediately given ten more faceoffs per game. In 2022-23 he was traded to Toronto, and that was the first season he had fewer than 20 faceoffs per game since 2015-16.
Examples of #2 centers are Jordan Staal (CAR since 2012-13) and David Krejci (BOS).
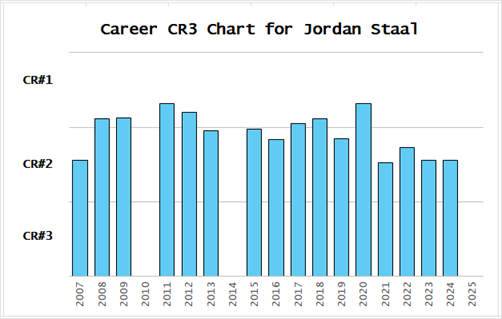
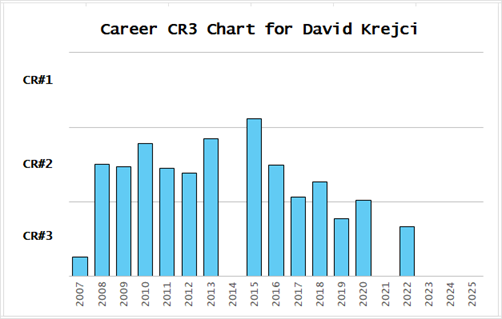
Staal’s typical CR3-Score was right around the CR#1 minimum threshold. The thresholds were established with the goal of getting about 25 #1 centers per season. While the specific values used for categories are “artificial”, that does not make them “wrong.”
Krejci was clearly a lesser center than Staal, with a lower CR3-Score in almost every season. Krejci is not a bad center because of that, he’s just not as good as Staal.
Casey Cizikas (NYI) was the very model of a modern #3 center (paraphrasing the lyrics from a song in the Pirates of Penzance).
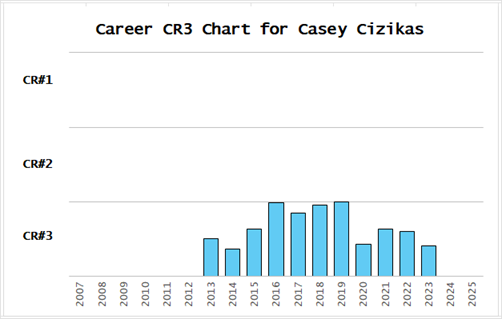
Cizikas was a defense-first center. He’d take about 14 faceoffs per game and win 52% of them; he’d get 13½ minutes of ice time a game, 2 minutes of those on the penalty kill; he’d get one point every third game; he did well in the defensive categories.
He probably wasn’t much of an offensive player, which reduced his ice time. Why tire him out with offensive zone faceoffs when he’s much more valuable defensively?
CR3 Top Ten, 2024-25 Season
This final table should help you see that CR3 does a good job of identifying the best centers in the league, if you are still in doubt. Twenty players in 2024-25 were in the CR#1 category and they are shown below, listed from the highest rated Nico Hischier to the twentieth rated Bo Horvat.
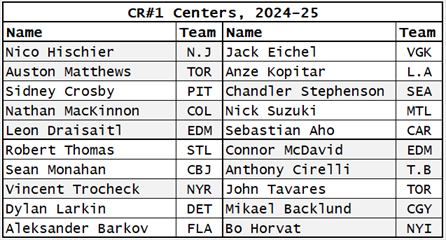
Mark Scheifele (WPG) missed being part of this list by a very thin margin. His CR-Score was 549.3 and the cutoff for CR#1 is 550.0.
Summary #1
The CR3 system evaluates the play of centers based on traditional concepts of what a center should do.
Summary #2
The statistics accumulated by a player are heavily impacted by his teammates. For CR3 some players are over-rewarded because they were the best center on their team, even though they were probably not one of the best centers in the league. Being “the best of a bad lot” led to them getting more faceoffs and more ice time.
Such is life.
Related Articles