
The off-season is an ideal time to examine the statistics themselves. In this article, Plus/Minus will be placed in the crosshairs.
Plus/Minus is not used by Stapled To The Bench (STTB). It took about two to decide not to use it for Productivity Rating (PR), our main rating statistic. I didn’t do any detailed research at the time; I just went with my gut feeling.
In this article, some detailed research is being done. The gut is big, but is it right?
When This Article Was Written
Starting with this article, I will include the date of authoring at its start. It isn’t always obvious in an earlier article when it was written.
This article was written during July and August 2025.
The Gut Says
The gut has never trusted Plus/Minus because it varies wildly at the player level from season to season. Consider Drake Batherson (OTT, F).
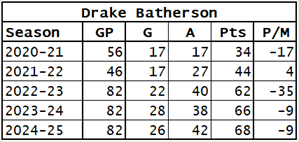
How does Batherson’s scoring data remain relatively consistent from season to season while his P/M data bounces around like a football rolling down a hill? And Batherson isn’t the only player who suffers from this problem.
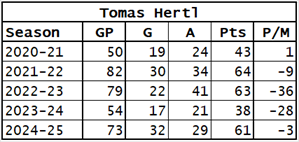
Tomas Hertl has a similar bounciness in his P/M data and a similar consistency in his scoring. Did Hertl forget how to play defense in 2022-23 and 2023-24, but then remember how to in 2024-25? The answer to that rhetorical question is NO.
Data for the tables in this section were retrieved from hockeydb.com. Have a little fun go there and check out Garry Unger’s statistics from his 1986-87 season playing for the Peterborough Pirates in the British Hockey League (30 games played, 238 points!).
What Influences P/M?
Goals: P/M has both positive (goals for) and negative (goals against) components.
A player’s team: good teams score more goals than they give up, giving their players better chances at having a good P/M.
On-ice teammates: It would seem obvious that the better the teammates you play with, the better your P/M will be. You’ll be on the ice when they score.
Opponents: It would seem obvious that the less capable the players you play against, the better your P/M will be. Your team will score more goals and give up fewer goals.
Role: Defensive specialists get lumbered with defensive zone faceoffs against the more offensively gifted opponents, which leads to more goals against and a lower P/M.
Special situations: It’s easier to score into an empty net than it is to score against an occupied net, even if you have an extra skater. Even strength is determined by the number of legs on the ice, regardless those legs are protected by goalie pads.
Goalies: If your goalie is a brick wall, you will have a better P/M. If your goalie is sub-standard, you will have a lower P/M.
Through the rest of this article, I will be using data largely related to Drake Batherson and entirely retrieved from NaturalStatTrick.com.
P/M and Goals For
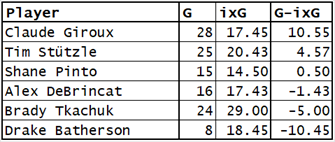
Let’s start with the scoring of goals. The following table has data for Batherson and three other players who played about the same amount of even-strength ice time. It shows their team’s expected goals for, actual goals for and the difference between them when these players were on the ice.
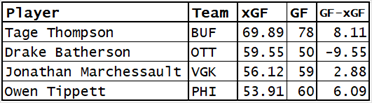
Batherson is the only one of those four players whose offensive performance was below expectations: Ottawa didn’t score as much as it should have when Batherson was on the ice. Was that Batherson’s fault? Surprisingly to me, the answer is “yes.”
Why was that surprising to me? Because Batherson was a frequent linemate of Brady Tkachuk, and I know that Tkachuk is one of the worst finishers in the league (see the article Players and Expected Goals – Finishing). I expected Batherson’s team-level offensive discrepancy would be more caused by Tkachuk and DeBrincat than by him.
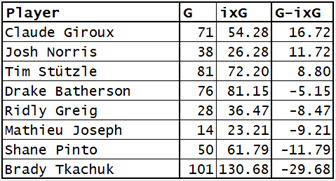
The following chart shows data from the last three seasons for Ottawa’s eight most-used forwards (most time on ice, all game situations, where Tkachuk’s contribution stands out.
In 2022-23 at even strength, Batherson and Tkachuk had different results. As shown in the following table.
In 2022-23, part of the reason Batherson had a very low P/M was that he failed to score as frequently as he should have. P/M does not do a good job of measuring a player’s offensive play, as it can be lessened if he (or a teammate) is a poor finisher.
P/M and Teams
Good teams score more goals than they give up, while bad teams give up more goals than they score. In the following table, you will see the counts of players who had a P/M of more than +6 and of players whose P/M was below -6, by team.
The data comes from the 2022-23 season. Only the top and bottom six teams (in terms of the player P/M counts) are displayed. Also in the table are each team’s even strength goals for and goals against.
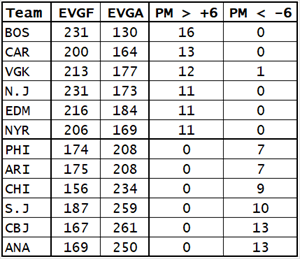
Here’s a telling question: was every one of the sixteen Boston players with a P/M of at least +6 better than every one of the thirteen Anaheim players with a P/M of -6 or lower? Keep in mind that Boston was an excellent team that season, while Anaheim was not.
Even an ardent Boston fan would have to admit that the better players on Anaheim (Cam Fowler was PR-Star, Troy Terry and Trevor Zegras were PR-First5) were better than some of Boston’s crew (David Krejci, Matt Grzelcyk and Trent Frederic were all PR-Regular).
These data show that the team a player plays for can have a huge impact on his P/M. Had Batherson been playing in Boston or Carolina, there is no way his P/M would have been -35: it would almost certainly have been positive.
P/M and Teammates
The difference between a team and a teammate is that a player plays ON a team but plays WITH a teammate. In Batherson’s 2022-23 season, he shared the ice at even strength with ten different teammates for at least 250 minutes each.
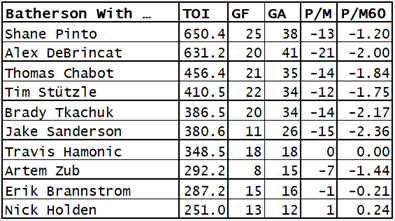
GF and GA are goals for and goals against at the team level. P/M is the even strength Plus/Minus, and P/M60 is P/M per 60 minutes.
Note that the PM/60 values were quite low for several players that Batherson shared the ice with. While Batherson had some impact on their P/M values, he was only 20% of the players on the ice (or 25% at 4v4, or 33% at 3v3).
A player’s P/M can be affected by his teammates. In Batherson’s case, he was adversely affected because he shared the ice more frequently with Chabot and Sanderson than with Hamonic and Holden. (Yes, I double-checked that Hamonic’s data was correct.)
P/M and Opponents
To measure the skill level of the opponents a player faces in a season, I used Drake Batherson and a forward who played about the same number of minutes at even strength in 2022-23: Tage Thompson (BUF).
I got data on the opponents they faced (5v5) from NaturalStatTrick.com, the key datum being the amount of time they were on the ice together. For example, Batherson was on the ice against Johnathan Kovacevic (MTL, D) for 17.58 minutes, while Thompson was on the ice against Kovacevic for 2.60 minutes.
I then went to the STTB statistics and got each opponent’s PR-Score. Finally, I calculated the average time-weighted PR-Score of (AveOppPR) Batherson and Pinto’s opponents.
The results were surprising to me. Their AveOppPRs were close: 4.58 (Batherson), 4.81 (Thompson). I thought it might be larger.
The feeling I have now is that level of opposition doesn’t vary much for players who play over 1,000 minutes at even-strength over the season, and since the level of opposition is fairly constant, then the impact on P/M should be negligible.
P/M and Role
The biggest deficiency in the P/M statistic is that it does not accurately reflect a player’s defensive contributions.
Here is the train of thought that leads to that opinion. When do teams give up the most goals? When the faceoff is in their defensive zone. Who is sent onto the ice when a team has a faceoff in their defensive zone? The better defensive players on the team. P/M will be lower for the better defensive players on a team because they are on the ice for a disproportionate share of defensive zone faceoffs.
The next chart is based on statistics from 503 players from 2022-23, consisting of every player who played at least 600 minutes at even-strength. For each player, their defensive faceoff frequency (DFO) was calculated, putting them in one of three groups. The Low group had 51 players whose DFO was below 28%; the Medium group (Med) had 410 players whose DFO was between 28% and 38%; the High group had 42 players whose DFO was above 38%. The columns show what each group’s P/M would be per 1,230 minutes (15 minutes per game for 82 games).
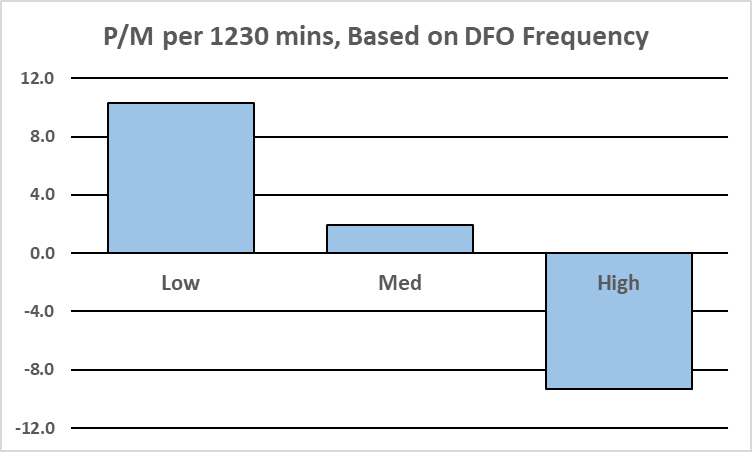
As one would expect, the players who have a high frequency of defensive zone faceoffs have a negative P/M because they are constantly put in the most dangerous defensive situations.
P/M does not reflect the defensive skill of a player. In fact, it penalizes defensively skilled players. (This is not a problem for Batherson, who is in the DFO-Med group.)
P/M and Special Situations (Powerplays, Penalty-kills, Empty Nets)
P/M is not just about even-strength scoring. Players are rewarded in P/M if they are on the ice when their team scores a short-handed goal and penalized if they are on the ice when their team concedes a shorty.
In 2022-23, Batherson was on the ice seven times when Ottawa gave up a shorty, reducing his P/M by 7. This is not entirely his fault, as he was only 20% of the power play unit.
While I don’t mind blaming that season’s goaltenders for giving up goals they shouldn’t have, this wasn’t the case for Ottawa’s power play: Ottawa’s expected goals against when Batherson was on the power play was 7.65. But Ottawa did have a problem in that their power play gave up more scoring chances than league average. At league average, Batherson would have been on the ice for 5.34 expected goals against. Shoddy power play defense (a rarely used phrase) cost Batherson 2 goals towards his P/M.
Batherson did not get a chance to redeem himself on the penalty-kill by scoring a shorty, as he only had 3.5 minutes of PK ice time.
Empty net situations can also affect P/M. The following table shows Ottawa’s top six skaters (based on time-on-ice) from 2022-23 when they had the empty net or played against an empty net.
A small positive for Ottawa in the 2022-23 season is that they were better than league average when only one goalie was on the ice. Ottawa’s defensive efforts when playing against the empty net were impressive: maybe their opponents were surprised they had to pull their goalies against the woeful Sens.
Across the league, the team which pulled their goalie scored 189 goals and gave up 438 goals. I’m pretty sure this includes instances when teams pulled their goalie due to a delayed penalty, and that play was 99.9% risk-free: the other team couldn’t score.
P/M can be affected by short-handed goals and empty net goals. While it is accurate to give a player a minus for being on the ice for an empty net goal against, it isn’t really fair.
P/M and Goalies
The following table shows Batherson and the same three players that were shown in the P/M and Goals section. xGF and xGA are their team-level expected goals for and goals against. xP/M is their expected goals Plus/Minus. The table concludes with even strength goals for, goals against and even strength P/M.
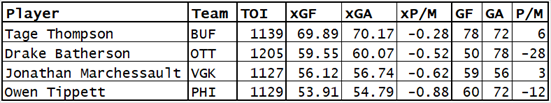
Batherson’s actual even-strength P/M should have been within a goal of the other three players, but in two instances, he is 30 goals worse. Why is that? It cannot be the teams, because Buffalo wasn’t much better than Ottawa. It was the goalies.
A player’s defensive play is best measured by expected goals against, the number of goals his team would concede based on the quality and quantity of shots their goalies faced when that player is on the ice. In Batherson’s case, he should have been on the ice for 60 (60.07) goals against, not 78. Those extra 18 goals are the fault of Ottawa’s sub-standard goaltending in 2022-23.
How can these 18 goals be blamed on the goalies? Because the expected goal statistic is extremely accurate. At even strength in 2022-23, teams scored 6,271 goals and had 6,256.06 expected goals, so expected goals were 99.8% accurate with respect to goals.
We must understand that when a goalie gives up more goals than expected, it is not because he was facing more difficult shots but because he didn’t stop the shots that an average goalie would have. Had he faced more difficult shots, his expected goals against number would have been higher.
Great goalies can increase the P/M of their teammates, while lesser goalies can decrease the P/M of their teammates.
Was the Gut Right?
When deciding which statistics to use to calculate Productivity Rating, my gut told me not to use Plus/Minus. While researching P/M for this article, my gut repeatedly said, “told ya so.”
The purpose of PR is to “quantitatively attribute” a player’s season. The higher a player’s PR-Score, the better his season.
As we saw in the detailed sections of this article, P/M was influenced by things other than the player against whom P/M was tracked. Teams, teammates, goalies, roles and playing situations all influence P/M.
If P/M were a good measurement of a player’s contribution to his team, wouldn’t the best players in the league have the highest P/M? The best player in 2022-23 was, far and away, Connor McDavid. He ranked 46th in P/M. He ranked behind Trent Frederic.
P/M will over-reward players who: play on a good team; play with high-scoring linemates; play with a good goalie; get lots of offensive zone faceoffs.
P/M will penalize players who: play on a bad team; play with low-scoring linemates; play with a bad goalie; get lots of defensive zone faceoffs.
Summary
In the previous section, I used the phrase “quantitatively attributes.” It is now one of my favourite phrases to use. I stumbled on it when I asked my Google Home, “What is the temperature?” and it told me what temperature was: “temperature quantitatively attributes hotness or coldness.” I had to rephrase my question to find out it was 33C, why my gut tells me it is uncomfortably hot.
Related Articles