
The evaluation of Draft Classes is one of the favourite things I do with hockey data. My initial three articles on this subject addressed what one should expect from a draft pick, which teams had done well at the draft, and which classes had produced the most talent.
Once the offseason begins, one more class becomes eligible to be rated, and I happily push numbers around for a few hours. But the hockey world is changing, and those changes will have an impact on the way I evaluate Draft Classes. This article will begin with a couple of sections on the evaluation of Draft Classes, then it will focus on the Class of 2019 as a class and finish off by looking at the players of the Class of 2019.
Does Stapled to the Bench (STTB) Have an Obsession with Draft Classes?
I think a better term than obsession is fascination. When STTB began, the big three ideas were: the rating of players based on NHL statistics, studying the effect of aging on the careers of players, and rating Draft Classes.
Productivity Rating (PR) rates players: one goal achieved.
Value Rating (VR), an offshoot of PR, allows me to study how effective players are as they age. There are four certainties in life: death, taxes, ministers delivering over-long sermons and older players suffering a deterioration in their skills.
PR also allows me to rate Draft Classes. PR-Score was designed to be addable, which allows me to calculate the average PR-Score of a defensive pair, or of a forward line, or the total PR-Score of a player over several seasons.
Evaluating Draft Classes – The General Approach
We’ve all seen the talking heads on draft day explaining why the players who are being drafted today will make up the best class ever. While their opinions are much more believable than my opinions would be on draft day, that’s all they have: a better opinion.
This is Stapled to the Bench, and we don’t do opinions here. We do statistics. The proof of a Draft Class is in its playing, if you don’t mind the paraphrasing.
Like a good wine, a Draft Class needs time to mature. You need time to see how well the entire Class plays. STTB’s opinion is that a Draft Class needs six years of maturing before it can truly be savoured. Six years was chosen as the “proving time” because of an assumption that the drafting team has control over the drafted player for at least that period of time. In those six seasons, the team may choose to play a drafted player immediately, keep him in the minors for a few years, keep him in the minors for the entire six years or even trade him.
All Draft Classes are evaluated with the same time frame as a matter of fairness. Without a time limit, the 2007-08 Draft Class would have a ten-season advantage over the 2017-18 Draft Class, and their career accomplishments would be overwhelming.
Measuring Player Contributions
My original metric for evaluating Draft Classes was Return from Play (RFP), which was a dollar value based on a player’s PR-Score in a season. At that time, I felt using PR-Score would be too abstract and that a unit of measurement that was familiar to readers (salary dollars that respected a salary cap) would be more concrete in their minds.
For example, the number one draft pick in 2007, Patrick Kane, had a PR-Score of 8.4 in 2009-10, which led to an RFP of $6.68 MM (MM means million). RFP values were based on an NHL salary cap for teams of $82 MM.
RFP was all well and good when the salary cap was stable, but it is about to explode upwards. If I kept calculating RFP with respect to an $82 MM salary cap, the values would quickly become as arbitrary as PR-Scores are. If I adjusted RFP each year to reflect the current salary cap, then I’d have had to recalculate RFP for all seasons each time I did a draft article. It was looking to be a lot of work, and I don’t like doing a lot of work.
The new method for evaluating Draft Classes is to drop the RFP stuff and just use the abstract numbers from Productivity Ratings (PR). Specifically, the Class rating will be the sum of the PR of all drafted players in the six seasons after the draft. Looking back at Mr. Kane, his PR-Score of 8.4 in 2009-10 will always be 8.4, regardless of the salary cap.
An example of the contributions a player makes to his Draft Class will be in the section titled Six Guys Named Ryan. (That sounds like a band name, doesn’t it? Especially if nobody in the band is named Ryan.) The following section will consider whether changing the method of evaluating Draft Classes resulted in changes to our understanding of those Classes.
Does Changing the Unit of Measurement Change the Results?
There are two changes in the unit of measurement for Draft Classes, neither of which is large, but both of which should be understood.
The first change has already been broached: using PR instead of RFP. The second change is that, as of April 2025, a new method for calculating PR has been adopted.
The new PR method does a slightly better job of recognizing the defensive contributions of players. At the league level, total PR for all players using Method 2 is within 1% of the total PR from the original method (Method 1).
The Draft Classes: PR vs RFP chart below shows that changing from RFP to PR has had almost no impact on the evaluation of each Draft Class.
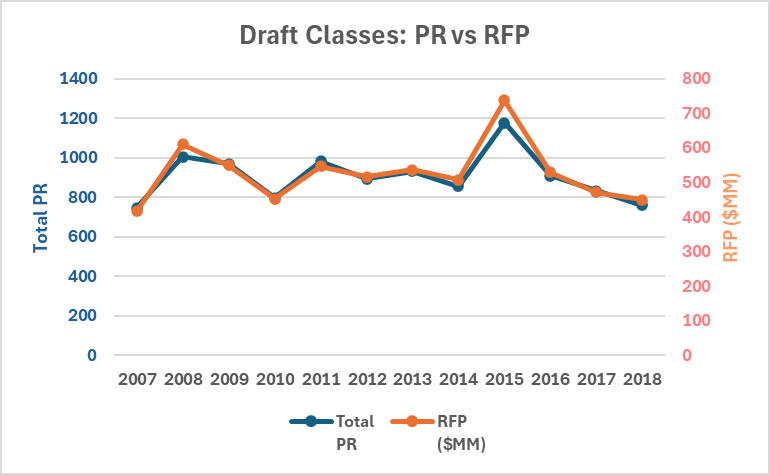
It is evident that the two lines show great similarity. The only “big” difference is with the Class of 2015: RFP gave a slightly higher value to PR-Elite and PR-Star seasons, and that Class had more than its fair share of PR-Elite and PR-Star seasons.
There is only one difference in the order of classes when using PR: the Class of 2011 went from being slightly behind the Class of 2009 to being slightly ahead of it. Both Classes are within 1% of the other using RFP, and both are within 1% of the other using PR. Technically, using PR, the Class of 2011 is the higher-rated class. Practically, using common sense, the two Classes are equal.
Six Guys Named Ryan
The following table shows data for six drafted players whose first name was Ryan. The data comes from the first six seasons after the draft. Players are sorted by their 6-Year total PR-Score, which is their “Draft Return.”
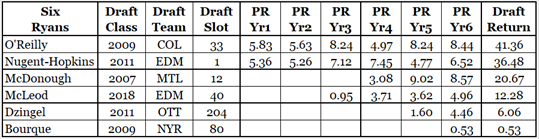
While McDonough was eventually as productive as O’Reilly and Nugent-Hopkins, he made a lesser contribution to his draft class because he did not play in the NHL until his fourth post-draft season. When evaluating a draft class, it doesn’t matter how good a draftee eventually becomes: the only thing that matters is his play in the NHL in his first six post-draft seasons.
Dzingel, with a small-looking return, was not a disappointment. The “expected” return for a player drafted in the seventh round is a Draft Return of 1.0. Bourque’s small return is, on the other hand, a small disappointment. The expected return of a third-round draftee is a Draft Return of 2.0. This may strike you as a very low expected return for someone drafted so highly, as it is the equivalent of one PR-Fringe season. For the logic that led to the establishment of expected Draft Returns, please see my (upcoming) article Value of a Draft Pick – 2024-25 Update.
Another point I’d like to stress about player contributions is that STTB does not rate Draft Classes solely on a Class’s best players; it rates Classes based on all of its players. Sure, some Classes that have low ratings also had some good players in them. But those Classes only had a few good players, and they also had lots of draftees who did not play in the NHL in their first six seasons.
It is now time to introduce the Class of 2019. Where does it stand with respect to the other Draft Classes?
Class Rankings – Introducing the Class of 2019
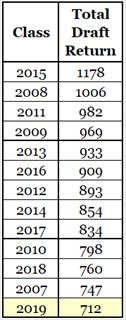
The first table shows Draft Classes in order of merit, from the Class with the highest total Total Draft Return (Class of 2015) to the Class of 2019, which has the lowest Total Draft Return.
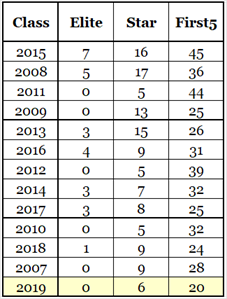
The second table shows the count of PR-Elite, PR-Star and PR-First5 seasons produced by each class’s players in their first six post-draft seasons.
The Class of 2019 has produced no PR-Elite seasons, but to be fair, many other Classes have no PR-Elite seasons. It has had six PR-Star seasons, which is definitely on the low side. Most significantly, it has produced only 20 PR-First5 seasons, well below the amount of any other Class. It has 26 seasons that rated PR-First5 or better (0 + 6 + 20): the second lowest Class in this regard is 2018, which had 34 such seasons.
The players of the Class of 2019 played a total of 273 seasons in their first six post-draft years: the average Class has 290 player-seasons.
Now it is time to consider the players of the Class of 2019.
Class of 2019 – The Top of the Class
The best player from the Class of 2019 is Jack Hughes, drafted number one by N.J. His Draft Return is 37.2, which places him 37th highest among all draftees between 2007 to 2019.
The second-best draftee is Moritz Seider, drafted in slot 6 by Detroit. His Draft Return is 36.3, and his rank amongst draftees is 42nd.
Dylan Cozens is the third-best player from the 2019 draft. He was picked in slot 7 by Buffalo, his Draft Return is 28.1, and he ranks 89th.
Rounding out the top four is Matt Boldy: pick 12(Minnesota), Draft Return 27.5, ranks 96th.
The top four players were picked with the 1st, 6th, 7th and 12th pick. Let’s take a look at players who were drafted with the top ten picks, ignoring those already mentioned.
Kappo Kakko, whose name would be worth 30 points in Scrabble, was picked #2 by the New York Rangers and is technically a “disappointment”, in that his Draft Return (23.3) is below what would be expected of a #2 pick (31.0).
Kirby Dach was picked #3 by Chicago, and his return is about as expected (19.2, 21.0).
Bowen Byram went #4 by Colorado, and his return is about as expected (21.9, 21.0).
Alex Turcotte was drafted #5 by Los Angeles. It is safe to say this draft pick did not work out. His Draft Return is 5.7 while the expectation for a #5 pick is a Draft Return of 21.0.
Pick #8 was Philip Broberg, chosen by Edmonton. His Draft Return is 10.2, but the expectation for a #8 pick is 18.0, so that’s a disappointing result.
Pick #9 belonged to Anaheim, and they chose Trevor Zergas (20.4; 18.0; as expected).
Pick #10 was made by Vancouver: Vasili Podkolzin; 10.7; 18.0; disappointing.
Comparing the Class of 2019 with Other Classes
While the evaluation of a Draft Class does not focus solely on its better players, it is instructive to see how the better players from 2019 compare with those of other Classes. In the table below, I compare 2019 to the previous lowest rated Class (2007), the middle-ranked Class of 2012 and the highest rated Class (2015). Colours in cells reflect their average annual Draft Return, using the rainbow order (red, orange, yellow, green, blue, purple). Connor McDavid is the only draftee to have an average PR-Elite rating in his first six post-draft seasons
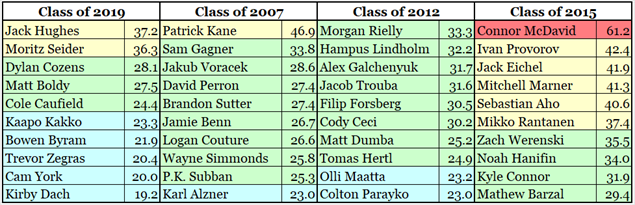
Mikko Rantanen is the sixth-best player of the Class of 2015, yet his Draft Return is higher than that of Jack Hughes (highest rated Class of 2019 player). The tenth-best rookie from the Class of 2019 is Kirby Dach. He would have been 16th in the Class of 2007, 20th in the Class of 2012 and 21st in 2015.
Summary
Looking forward, the Class of 2020 is on track to be rated between the Class of 2010 and the Class of 2017, with a projected total Draft Value of 820, which is below average. The Class of 2020 features Tim Stutzle (drafted by OTT), Lukas Redmond (DET), Seth Jarvis (CAR) and Jake Sanderson (OTT).
Alexis Lafreniere was the #1 pick (NYR) and is currently the fifth-best player from that draft. While it may feel like he has had a disappointing career, that is caused by where he was drafted rather than what he has done. If it was a mistake for him to be drafted #1, that mistake was not made by Lafreniere. It was made by the Rangers.
Related Articles
Productivity Rating – Method 2