
I always have a long-ish list of articles I plan to write, or at least, articles that I will write if the research works out. Along with a working title, there is usually a short description of what I am trying to accomplish with the article.
On that list was a suggested article whose entire entry consisted of two words: Goalie Value. I must have thought the rest was obvious.
When This Article Was Written
This article was written in August 2025.
The Obvious Context
Stapled To The Bench (STTB) has player ratings that reflect both a player’s season (Productivity Rating, PR-Score) and his value (Value Rating, VR-Score). STTB has a goalie rating that reflects a goalie’s season (Goalie Expected Points, GxPts), but does not have a rating for a goalie’s value.
To put that in a grammatically correct format, STTB did not have a goalie value rating. It does now (Goalie Value, GxVal), as you will see.
Borrowing From Value Rating
VR-Score is the weighted average of three seasons of PR-Scores. GxVal will be the weighted average of three seasons of GxPts.
To qualify for a VR-Score, a player must have played at least half of the games of the previous three seasons. To qualify for GxVal a goalie must have played in at least one game in all three previous seasons.
VR-Score’s calculation process is somewhat complicated. That’s where we stop borrowing things: GxVal’s calculation process will be comparatively simple, borrowing only the results of the complicated GxPts calculations.
Calculating GxPts
If you want a complete explanation of the calculation of GxPts, please see the article Goalie Expected Points – A Rating System. The examples below will show you the results of those calculations, which should be enough to prove that GxPts works as a goalie rating system.
Four goalies will be used as examples, or rather, two pairs of goalies. Each pair of goalies played about the same amount of time, but ended up with significantly different GxPts.
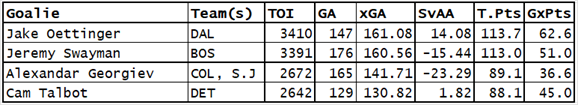
The key data for GxPts are time-on-ice (TOI), goals against (GA) and expected goals against (xGA).
TOI is used to create T.Pts, which represent how many points a goalie could have earned had he never given up a goal (2 points per 60 minutes of TOI).
GA and xGA are used to determine saves above average (SvAA), which indicates how well the goalie played. Then a more complicated formula (see the article if you’re truly interested) determines how many points the average team would have had based on a goalie’s SvAA.
Oettinger (DAL) and Swayman (BOS) had similar xGA data (161.1, 160.6) but markedly different GA data (147, 176). As a result, Oettinger had 62.6 GxPts while Swayman had 51.0 GxPts. Swayman sat out the preseason and missed the first several games of the season in a contract dispute and did not play well on his return.
Georgiev (COL, S.J) and Talbot (DET) were paired for the same reasons as Oettinger and Swayman: close to each other in minutes but well separated by SvAA. The better goalie in both pairs (Oettinger, Talbot) had significantly higher GxPts.
I always feel it is necessary to defend using xGA in rating goalies, rather than goals against average or save percentage. A goalie’s GA and xGA data are almost perfect measures of a goalie’s performance, while both goals against average and save percentage can be heavily influenced by the goalie’s team.
With GxPts you cannot argue that one goalie is poorly rated because he faced tougher shots than other goalies. The strength of the shots he faced is measured by xGA. A poor goalie who gives up more goals than he is supposed to will not do well in GxPts.
With GxPts you cannot argue that one goalie is poorly rated because he faced many more shots than other goalies, because GxPts is based on the difference between GA and xGA, not the quantities of GA and xGA. A good goalie on a bad defensive team will do well in GxPts.
Calculating GxVal
To qualify for GxVal, a goalie must have played in at least one game in each of the three previous seasons. Matt Murray (2024-25 TOR) did not qualify for GxVal in 2024-25 because he did not play in the NHL in 2023-24, while Yaroslav Askarov (2024-25 S.J) did qualify because he played 58 minutes, 82 minutes and 717 minutes in the last three seasons.
This criterion will allow for many more goalies getting GxVal than just the regulars and the backups, but I’m okay with that for two reasons. First, it is quite simple to gather the data and do the calculations. Second, the low-playing qualifying goalies will have very low GxVals. No one-game-per-season wonder will be in the top 60 goalies in any season.
For qualifying goalies, the GxPts values from their three most recent seasons are multiplied by weights that give a higher importance to the most recent season (5, 4 and 3 are the weights). The three weighted GxPts values are added together and divided by 12 (5+4+3) to produce GxVal. The following table shows those words in numbers, using four goalies as examples.
Each goalie’s GxPts data will be presented using two rows. The top (unshaded) row will have his raw GxPts for a season, while the bottom (shared) row will have is weighted GxPts for that season. The total weighted GxPts of those seasons is also shaded.
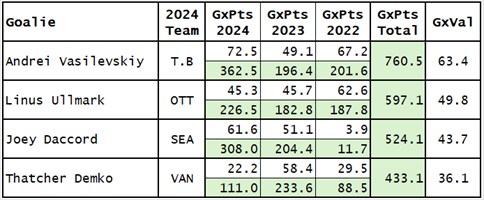
The selected goalies were rated 4th, 13th, 22nd and 31st in 2024-25 based on GxVal. Vasilevskiy has had three good seasons; Ullmark is lower-rated than you might expect because his time-on-ice is lower than you might expect (injured in Ottawa, net-sharing in Boston); Daccord’s last two seasons were good, but he did not play much in 2022-23; Demko has had one good season in the last three.
2024-25 Top Ten Goalies by GxVal
The row shadings in the following table are used to make it easier to follow a specific goalie’s data across the table.
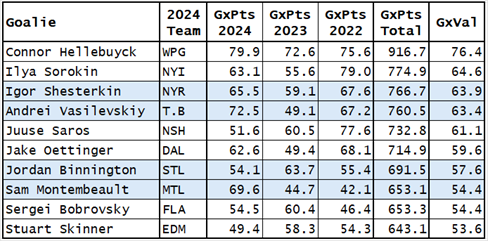
If Hellebuyck wasn’t the runaway number one goalie in GxVal in 2024-25, I would freely admit that GxVal was incorrect.
Montembeault is at #8 because of his massive 2024-25 season. Had his last season been more like his 2023-24 and 2022-23 seasons, he would have been in 20th place. And if his two earlier seasons had been more like his 2024-25 season, he’d have been in 2nd place.
You may have noticed that neither Jeremy Swayman (BOS) nor Linus Ullmark (OTT) are in the top ten, despite their famed partnership in Boston in the 2022 and 2023 seasons. Swayman ranks 16th and Ullmark ranks 13th in 2024-25. The reason they don’t rank higher is that they had a partnership: they split ice-time between them. This served to reduce the number of points (T.Pts) they could have had, which in turn reduces their GxPts.
GxPts doesn’t care why a goalie played a lesser number of minutes. It could have been due to net-sharing, it could have been due to injuries, or it could have been due to sub-par performances. In 2022-23 and 2023-24, Swayman and Ullmark shared the Boston net, reducing their individual TOI. In 2024-25, they had lower-than-expected TOI due to holdouts and poor performance (Swayman) and injuries (Ullmark).
Summary
GxVal does an excellent job of rating and ranking goalies. It accurately identifies the goalies who played the best over the last three regular seasons.
Admittedly, in looking at three seasons of data, it might not address who the better goalies would be if you needed to win one game. The following table shows which goalies led in SvAA60 over the last three seasons, which might provide a better answer for the “win one game” crowd.
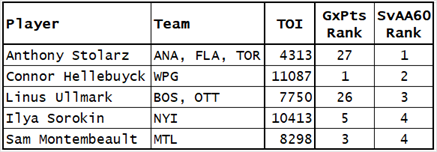
Last game of the season, your team must win to make the playoffs, and they are allowed to use any goalie in the league because they are currently in the good graces of Mr. Bettman. Would you be annoyed if your team chose to use Anthony Stolarz instead of Connor Hellebuyck, or Ullmark, or Vasilevskiy? I would be. Even if I were a Maple Leaf fan.
Related Articles