
I read a post/article somewhere online regarding a change in a certain player’s High Danger Chances (HDC) data. He had been “generating” HDC as much as he usually did but he himself had far fewer HDC shots than he usually did.
Sometimes you read something and you look at hockey data a different way as a result. Can hockey statistics be used to identify players who help their teammates get HDCs?
When This Article Was Written
This article was started in early November 2025.
Statistic Name Short Forms, Suffixes and Prefixes
My professional background is in computer programming. When I’m working on statistics now I revert to practices I would have used when programming: I shorten variable names for convenience and add prefixes and suffixes to differentiate versions of the statistic.
The High Danger Chance statistic is shortened to HDC. HDC can be for or against: HDCF or HDCA. HDC can be expressed as a rate, either per game played or per 60 minutes: HDCFGP, HDCA60.
A player can take a high danger chance, which is iHDC (individual HDC). At the team level, there is tmHDCF and tmHDCA. Combining the individual and team concepts produces variables like itmHDCF, which is a count of all HDCF when a player is on the ice, regardless the player’s role in those HDCFs (he could have taken the HDC, set up another player for an HDC, or just been a spectator to another player’s HDC).
What Are High Danger Chances? What Statistics Exist?
HDCs are determined based on the location of a shot and, sometimes, the time the shot was taken with respect to the previous event. Close-to-the-net shots will always be considered HDC, while some medium danger chances (MDC!) will become HDC if the timing data indicates they were rebound shots. For a longer description of how HDCs are determined see the glossary tab on NaturalStatTrick.com.
HDC data can be found in the player-level on-ice report, the player-level individual report and the team-level season statistics report. Each report gives nuanced HDC data.
The player on-ice report tells us how many HDC a player was on the ice for, both for his team (itmHDCF) and against his team (itmHDCA). The individual report tells us how many HDC a player had (iHDC). The team report tells us how many HDC a team had (tmHDCF) and conceded (tmHDCA).
All the reports I used were filtered to 5v5 play. Player reports were split for multi-team players so there are separate records for a player for each team he played for. I took copies of those reports for the four seasons from 2021-22 to 2024-25 in an effort to identify HDC distributors over the span of four seasons.
Identifying HDC Distributors – It Isn’t Going to be Dead Easy
HDC data does not directly show players that “generate” HDC. They directly show players that take HDC shots (iHDC), and they directly show how many HDC shots a team had when a player was on the ice (itmHDCF).
Team-Level HDC – Confirming The Obvious
Let’s start by looking at a datum called HDCF60: High Danger Chances For per 60 minutes. Here are the league-level HDCF60 values for the last four seasons. TOI is time on ice.
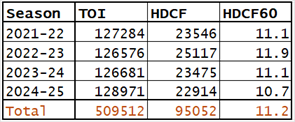
Since HDC should be good for a team/player, it follows that good teams should have more HDCF than bad teams.
I divided teams into two groups based on the points they accumulated in a season. Teams with 96 or more points were put in the playoff team group, while teams with less than 96 points were put in the non-playoff team group. For each group I determined how frequently teams were at least 1.0 HDCF60 above the four-season average and how frequently they were at least 1.0 HDCF60 below the four-season average.
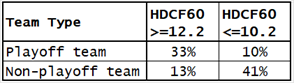
Across the seasons, playoff teams had higher HDCF60 than non-playoff teams. We can safely conclude that HDCF is a reasonable indication of good performance.
You may think that this was obviously going to be the result, and I agree with you. The reason I check the numbers is that there is a big difference between assuming a statistic will show something and knowing that a statistic shows something. I prefer to start any analysis with the confidence of knowing that the statistics are meaningful.
Player-Level HDC
There are two specific player-level HDC data to focus on: the number of times a player is on the ice when his team has an HDC (itmHDCF) and the number of times a player has an HDC (iHDC).
HDC Distributors will have higher itmHDCF values because they are on the ice for more HDC than players who do not generate HDC. But it is important to know that whenever an HDC happens, all of the players on the ice are credited with an HDC: the player who generates it (the distributor) gets an itmHDCF, the player who takes it (the recipient) gets an itmHDCF, and the other three players on the ice (the tourists) also get an itmHDCF.
As a fan of the Ottawa Senators, Artem Zub comes to mind: he is a defensive defenseman who is frequently on the ice with Stutzle, Tkachuk and Sanderson. When one of the “skill players” creates an HDC, Zub gets credit for an itmHDCF just for being the defensive conscience of the team. How, then, can we separate the Zubs from the Sandersons? Time will help, which is why I’m using four seasons’ worth of data. While Zub doesn’t always play with Sanderson, Sanderson always plays with Sanderson. Over time, Zub’s non-Sanderson time will show up in his season-level player data.
Identifying HDC Distributors – Step 1 – Thinning the Herd
As HDC Distribution is an imprecisely measured concept, I wanted to make sure I had a good amount of data to use. I hoped minor inaccuracies would balance out over time. To qualify, a player had to play in all four seasons between 2021-22 and 2024-25, and he had to have played at least 164 games in those four seasons. That is two seasons’ worth of games.
520 players qualified.
Identifying HDC Distributors – Step 2 – itmHDCF
Over four seasons, the players who have been on the ice for the most of their team’s HDCF opportunities (itmHDCF) are:
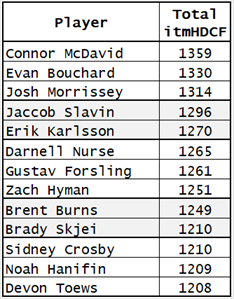
To me, a guy who is a hockey fan but is not a fanatic, there are a couple of surprises in this group. Nurse, Forsling and Skjei, if I’m being specific. It strikes me these are players who are on the list because of their situations rather than their talents.
On the other hand, I’ve been surprised by player names popping up on lists before. It is time to refine itmHDCF: we are looking for Distributors.
Identifying HDC Distributors – Step 3 – otmHDCF
I want a count of the HDC that happened when a player was on the ice excluding the HDC that the player himself had. That statistic will be called otmHDCF: other teammate’s HDCF.
While I strongly dislike treating defensemen and forwards differently, it is necessary here. Defensemen get very few HDCF. An adjustment affecting defensemen will be part of the otmHDCF calculation. For every iHDC a defenseman had, forwards had 5.7 iHDC. The adjustment for otmHDCF is achieved by multiplying a defenseman’s iHDC count by 5.7.
Connor McDavid was on the ice for 1,359 itmHDCF and he had 375 iHDC. His otmHDCF is 984 (1,359 – 375). Erik Karlsson was on the ice for 1,270 itmHDCF and had 53 iHDC, which becomes 302 when adjusted. His otmHDCF is 968. The top ten players in otmHDCF are shown below.
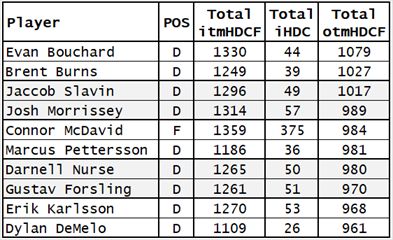
In the top 50 players in the league in otmHDCF, 41 are defensemen. The idea that most of the Distributors are defensemen does not strike me as reasonable. This data does not convince me that Darnell Nurse and Dylan DeMelo as significant HDC distributors.
There is one more piece of information that will play a critical role.
Identifying HDC Distributors – Step 4 – Assists
HDCF lead to goals, and if a player is an effective HDC Distributor, he’ll have a lot of assists.
It is an idea that is hard to argue with. How could an effective HDC distributor not have a lot of assists?
While the data do not show assists from HDC, the data show assists from all 5v5 play. I’m going to make a bold assumption that a player who is a good HDC distributor gets assists in non-HDC situations as well.
As I used total otmHDCF over the last four seasons to identify players who were most frequently on the ice when teammates had HDC, I decided to use total assists over the last four seasons to identify players who most frequently set up their teammates: not exactly a stroke of genius. The top players for assists are shown below. Remember, the totals shown are from 5v5 play!
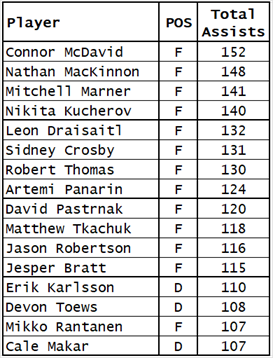
Darnell Nurse had 76 assists, Dylan DeMelo had 70: they are not anywhere close to league-leading counts. It is beginning to look like they are not HDC distributors.
Identifying HDC Distributors – Step 5 – Combining otmHDCF and Assists
In the design of almost any rating system, there comes a time when arbitrary decisions are taken, where lines are drawn in the sand. Players to the left of a line are in one category and players to the right of it are in another category. There will be players who will be very close to the line but on opposite sides of it, and they’ll be in different categories.
I arbitrarily decided that I would only recognize the best Distributors. Nobody really cases that Joel Hanley (D) is the lowest ranked in terms of HDC Distribution, they want to know who the best Distributors are.
Borrowing terminology from my Productivity Rating and Value Rating systems, the top Distributors will be designated Elite Distributors, while the second-level Distributors will be designated Star Distributors.
A player will be identified as an Elite Distributor if he is in the top 5% in otmHDCF and is in the top 5% in Assists. Star Distributors are in the top 10% in both otmHDCF and Assists (and are not already identified as Elite Distributors, obviously).
If otmHDCF and Assists were statistics that were distributed randomly through the 520 players, the odds are that one player would randomly be in the top 5% in both (Elite level) and that four others would be in the top 10% in both (Star level). The statistics are not distributed randomly, as six players are in the Elite level and nine more are in the Star level.
The Elite and Star Distributors (who are not listed in any particular order):
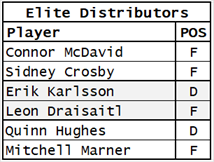
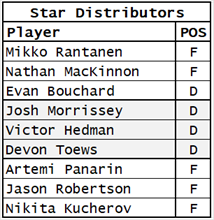
I am a little surprised at how many defensemen are listed, but not particularly surprised at their names. I was surprised to see Panarin on the list, as my impression of him was that he was more of an HDC Taker than a Distributor.
Is it possible to be both a Taker and a Distributor?
Identifying HDC Takers
I thought I’d finish this off with a quick look at the HDC Takers, the players who are either being set up by HDC Distributors or generating their own HDC. They were identified by total iHDC over the four seasons. The table below shows the top HDC takes and any teammates who were determined to be Elite or Star Distributors.
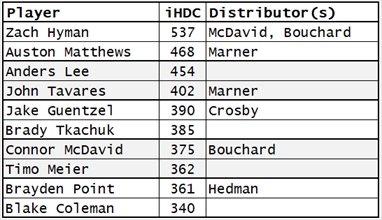
Connor McDavid is both a Taker and a Distributor, because of course he is.
HDC Distributors – Non-Distributors Mentioned Earlier in the Article
520 players who qualified for HDC calculations, so to be in the top 10% of otmHDCF and assists they would have to be ranked 52nd or better in each.
Artem Zub ranked 87th in otmHDCF and 308th in Assists.
Darnell Nurse ranked 7th in otmHDCF and 107th in Assists. He did not rank as a Distributor because he did not have enough assists.
Gustav Forsling ranked 8th in otmHDCF and 95th in Assists.
Brady Skjei ranked 24th in otmHDCF and 127th in Assists.
Honourable mention goes to Robert Thomas, who did not rank as a Distributor in spite of ranking 7th in Assists. He ranked 187th in otmHDCF.
Summary
If the players who were identified as HDC Distributors did not surprise you, I take that as a compliment. When a series of calculations identifies a group of players that “it should” identify, it means the calculations produce reliable results.
When there are players who are surprisingly on the list, as Artemi Panarin was to me, his presence on the list may be because the formulas are more inclusive. Even the most dedicated fan cannot watch ten games each of each team in the league, so there are players with whom they will be less familiar.
Related Articles
None.