
This article was motivated by a Major League Baseball statistic called Win Shares, which converts player statistics to a number that tells us how good the player’s season was. Other statistics which do similar things are Approximate Value (MLB) and PR-Score (NHL, from Stapled To The Bench, STTB).
One thing these three statistics have in common is that their ratings do not use team records. A baseball player could have a Win Share of 28 regardless of whether his team had a record of 92-70 or 70-92. Player Point Share (PPS), a new STTB statistic, combines a player’s PR-Score with his team’s record.
The invention of any statistic is usually a multi-step process, led by math and statistics, shaped by subjective evaluation. In this article, I will show the steps I went through to produce the PPS statistic, then I’ll show the league leaders in PPS.
Player Point Share
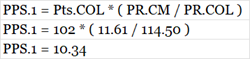
PPS will be a fractional number generated from a player’s PR-Score and his team’s standing points. Cale Makar had a league-leading PR-Score of 11.61, and his team had 102 points. PPS will estimate how many of those 102 points should be “credited” to Makar.
To avoid confusion that might come up later in the article, the unit of measurement for PR-Score is PR-Points (PRPts). PR-Score and PR-Points are terms that can be used interchangeably: Makar had a PR-Score of 11.61; Makar had 11.61 PR-Points.
PPS Calculations – Version 1
The idea for PPS was that each player would be assigned a portion of his team’s points based on his PR-Score and the total PR-Score of every player on his team. For players traded mid-season, their PR-Score was shared among the teams they played for, proportional to their time-on-ice for each team.
Cale Makar had a PR-Score of 11.61, and Colorado’s total PR-Score was 114.50. The calculation for his PPS.1 is shown below. Pts.COL is Colorado’s standing points, PR.CM is Cale Makar’s PR-Score and PR.COL is the total PR-Score of all Colorado players.
Devon Toews, a teammate of Makar, has a PPS.1 of 7.05. Samuel Girard, another teammate, has a PPS.1 of 4.86. Subjectively, these results are not accurate. Surely to goodness, the difference between Makar and Girard should be more than five standing points.
Good players on other teams suffer the same fate, being only a few points apart from the lesser players on their teams. PPS.1 is not fair to the better players on a team.
PPS Calculations – Version 2
My goal for all STTB statistics is that they be fair to all players. The problem with PPS.1 is that PR-Score is a bit logarithmic in nature. By that I mean that a player with a PR-Score of 10.00 is more than two times better than a player who has a PR-Score of 5.00.
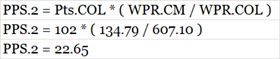
To solve this problem, I decided to use the square of a player’s PR-Score in the calculations (both for his PPS and for the team’s total PR-Score). Squaring puts numeric values on steroids: 4 becomes 16, 6 becomes 36, 8 becomes 64. Bigger initial numbers grow more than smaller initial numbers, and so players with bigger PR-Scores will get a bigger share of a team’s points.
The PPS.2 calculations for Mr. Makar are below. WPR stands for Weighted-PR-Score.
Toews came in at 10.51, Girard at 4.99. This is definitely an improvement. Makar is now well apart from Toews and Girard.
Mikko Rantanen is now entering the conversation.
PPS Calculations – Version 3
Mikko Rantanen played very well in 2024-25 while playing for three teams. But his PPS.2 is small because he did not get a lot of ice time with any of the teams he played with.
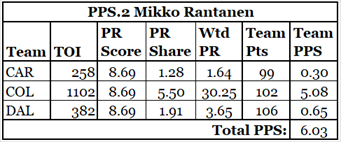
I put it to you that Mikko Rantanen was worth well more than 6 standing points. Auston Matthews had a PR-Score of 8.60 (in 67 games played) and had a PPS.2 of 12.41. Rantanen should be near Matthews.
The original approach for PPS.2 was to apportion a traded player’s PR-Score across the teams he played for, which in hindsight, is exactly the wrong thing to do. What should be apportioned is the total PR-Score and standing points of his teams. The formula should use a player’s PR-Score plus the weighted average of his teams’ standing points and his teams’ total PR-Scores.
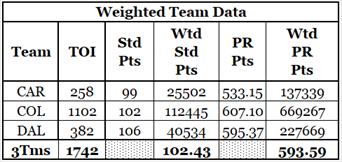
The Wtd columns show the result of multiplying the specific datum (standing points or PR-Points) by time-on-ice (TOI). The final row shows the values to be used in the formula, which are the sum of the team-weighted data divided by the total TOI. Rantanen’s weighted team standing points are 102.43, and his weighted team PR-Score is 593.59.
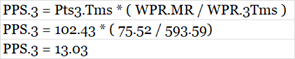
Rantanen’s PPS.3 is 13.03, which is in the neighbourhood of Auston Matthews’ 12.41 (PPS.3has the same as PPS.2for players who played on one team only).
At this time, I decided to go to one digit of precision for PPS scores. The number of decimal points a statistic has confers a degree of accuracy that may not be merited. That a number can be calculated with precision does not mean that the number reflects that which is being measured at that level of precision.
PPS.3 now seemed to be handling all types of players: stars, regulars, call-ups and those who were traded during the system. Only one thing left to check! Is PPS.3 fair when considering players from a number of teams?
PPS Calculations – Version 4
An STTB statistic has to be fair to all players. The last step of that assessment is to look at the PPS.3 scores for several players from several teams. Let’s look at the top six players from four different teams.
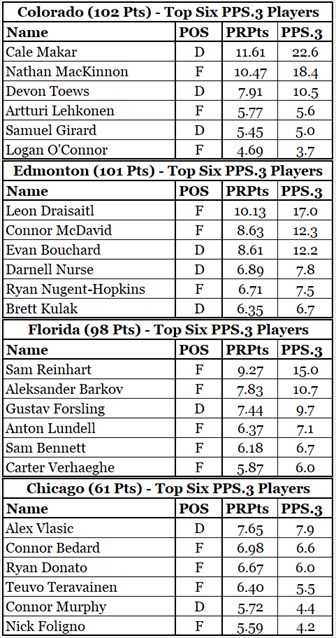
In Colorado, Makar and MacKinnon got 40% of the PPS.3. They were easily the two best players on the team, but 40% for two players strikes me as high.
Edmonton featured a three-headed beast, with the heads named Draisaitl, McDavid and Bouchard.
Florida was a one-headed beast. The Florida data would have been very interesting had Matthew Tkachuk not missed 30 games.
Finally, we have Chicago. No Blackhawk player had a great season, and the team didn’t have a great season. Yet their sixth-best player (Nick Foligno) had a PPS.3 of 4.2, which was higher than the sixth-best player on Colorado (Logan O’Connor, 3.7).
That is not fair.
The problem here is that the weighted PR-Scores used by PPS.3 are too high. When a team has several good players (Edmonton, Colorado), the PPS.3 of the good players is too high, while the PPS.3 of all the other players is too low.
The Goldilocks solution is to reduce the exponent used to increase PR-Pts. Rather than use 2.0, which changes PR-Pts from 7.00 to 49.00, I decided to use 1.5. That changes PR-Pts from 7.00 to 18.52.
By reducing the exponent used to produce weighted PR-Points, all players will get smaller weighted PR-Points, and the team total weighted PR-Points will also be lower. The better players will get a smaller share of team points than they had in PPS.3. Let’s see what PPS.4 has to offer.
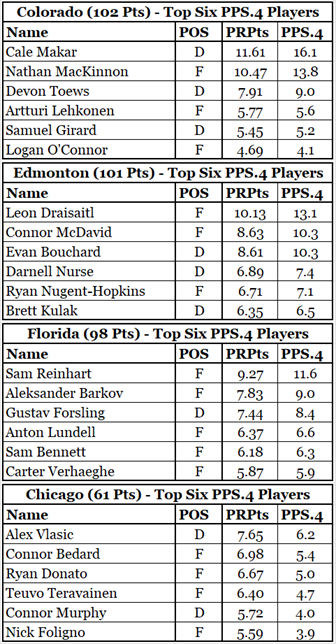
Now, Logan O’Connor, the sixth-best player on Colorado, has a higher PPS.4 than Nick Foligno, the sixth-best player on Chicago. While Foligno’s PR-Score is higher than O’Connor’s (5.59 to 4.69), Colorado had 102 points in the regular season, and Chicago had 61 points.
The rest of the players shown in these tables appear to have appropriate values, with respect to their teammates and with respect to players on other teams.
PPS.4 will be the final version of Player Points Share, and from now on I’ll use the short form PPS to represent it.
On to the top twenty players!
PPS 2024-25 Top Twenty
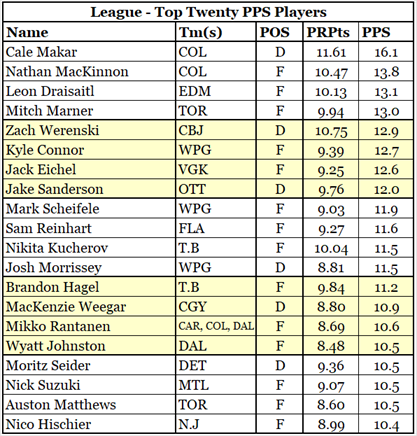
The top twenty largely consists of the better players from the better teams. The lowest ranked player in terms of PR-Score is 31st in the league (Wyatt Johnson), and the average standing points of the top 20 players’ teams is 102 (compared to the league average of 90).
Draisaitl and McDavid have lower PPS values than you might expect for two reasons: each missed a number of games, and each had Bouchard as a teammate. McDavid and Bouchard tied for 21st PPS.
Zach Werenski is on the list because he was a great player on a poor team. He was credited with a large portion of Columbus’s points because no other Columbus player came close to his PR-Score.
Washington has nobody in the top twenty. The next section goes into some detail about how the structure of PPS did no favours for Washington’s players.
Winnipeg had three PR-Star players who all made the top twenty, as Winnipeg had 116 points in the regular season. Winnipeg had a lot of standpoints to share.
A Few Too Many Good Men
With respect to PPS, the problem with Washington was that it had too many good players. The following table compares the top 10 Capitals with the top 10 Golden Knights, who had one player in the top 20 of PPS.
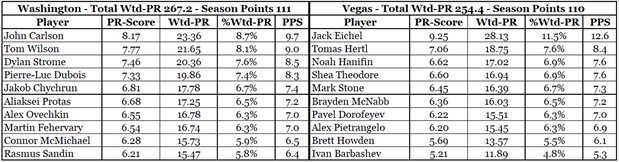
Vegas had the better player in 2024-25 (Eichel), but in spots 2 through 10, each Vegas player had a lower PR-Score than the corresponding Washington player. The difference between Eichel and Hertl, the second-best Golden Knight (does that make him a Silver Knight?) is 2.19 PR-Points, while the difference between Carlson and Wilson is 0.40 PR-Points. The difference between Carlson and Rasmus Sandin, the 10th best Capital, is 1.96 PR-Points: that gap is smaller than the gap in Vegas between Eichel and Hertl.
As a result of his relatively low PS-Score (39th in the NHL) and the large number of teammates that had good PR-Scores, John Carlson’s share of Washington’s points is low. Hockey is a team game, and Washington was a strong team that essentially had two first lines and two sets of first-pair defensemen.
Summary
PPS provides us with another way to look at players. To paraphrase Bill James, a baseball researcher, PPS is a conversation starter, not a conversation ender. Who are the league leaders in PPS? Generally, they are standout players on good teams.
Washington was the second-best team in the league yet had no PPS leaders because they had ten very good players and no truly excellent players.
David Pastrnak was 12th in the league in PR-Score but did not crack the top 20 in PPS because Boston only had 76 points in the regular season. Boston would have needed five more points in order for Pastrnak to have edged into the PPS top 20.
Related Articles