
As I was planning how I would do things at Stapled to the Bench (STTB), pretty much on the top of the list was that I would not change the formulas for any of the statistics I created. I imagined it would require an update of all articles associated with the statistic.
But you live and you learn. Through work I’ve done on a couple of articles, I learned that one statistic used in Productivity Rating (PR), one component of the formula, did not measure what I thought it measured. I decided to change it after having grappled with the issue of updating articles that used PR.
The State of Existing Articles That Use PR
I decided that there was no need to review and update articles that use PR, not (entirely) because I am lazy: it is because those articles remain accurate. While PR-Scores are changing, they are not changing much.
What Component of PR Was Misunderstood (by the Author)?
The statistic that I misunderstood was “Team-Relative Corsi (TRCor).” TRCor is the difference between a player’s Corsi and his team’s Corsi in the same amount of ice time.
I thought TRCor would reward players who improved the play of their team, either by driving down the scoring chances of opponents or by driving up the scoring chances of their team. I was hoping this would reward good defensive players.
While working recently on other articles, I discovered that Corsi is heavily influenced by how frequently a player takes defensive zone faceoffs. If you take a lot of offensive zone faceoffs, you are going to have a much better Corsi than if you take a lot of defensive zone faceoffs. Good defensive players, who get lots of defensive zone faceoffs, are hurt by TRCor.
Another point that recent work brought to my attention was that expected goal data was more important than Corsi. In terms of “importance” of statistics, you can start with the least important statistic and work your way to the most important statistic: hits, faceoff wins, blocked shots, takeaways and giveaways, Corsi, shots, expected goals, and goals.
I felt compelled to do something. One component of PR was not providing the information I hoped it would, and I really wanted a defensive component included in PR.
What is the New Component?
The replacement component is a measure of a player’s defensive abilities but is laden with a god-awful name: Defensive Zone Faceoff Balanced Expected Goals Against (DZB.xGA).
The new component compares a player’s xGA against the average xGA of a player who played the same amount of time and took the same number of defensive zone faceoffs. Aaron Ekblad (FLA, D) will serve as our exemplar.

In 783.62 minutes of 5v5 play, Ekblad’s xGA was 29.06. 34% of his faceoffs were taken in the defensive zone. A player who played 783.62 minutes while having 34% of his faceoffs in the defensive zone should have an xGA of 34.61. Ekblad’s xGA was 5.55 better than that. That is, as it turns out, pretty good.
Not everybody gets a positive result. Below are the data of Michael Carcone (ARI, F).
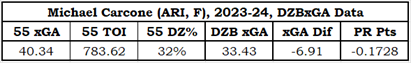
It is nice that Mr. Carcone and Mr. Ekblad had exactly the same amount of 5v5 ice time. Mr. Carcone had a slight advantage in defensive zone faceoffs (32% instead of 34%), which gave him a lower DZBxGA (33.43 instead of 34.61). His actual xGA was 40.34, which means he was on the ice for more expected goals against than he should have been, which led to him getting negative PR Points for this component.
Who Will This Change Help? Who Will it Hinder?
As I am replacing a statistic that helped offensive players with one that helps defensive players, this change will help good defensive players. It will hinder good offensive players who don’t actually play well defensively.
It will provide a bit of help to players on good teams and will be a small detriment to players on bad teams. Expected goal data reflects on both a player and the teammates he plays with.
What Else Got Changed in the Productivity Rating Formula?
I did not want the new formula to produce drastically new information, so I slightly increased the reward for goals and assists. If I hadn’t done this, the top players in the league would have had too many defensemen and too few forwards.
It is a goal for me that, over time, the top players should be 40% defensemen and 60% forwards, because normally a team has two defensemen and three forwards on the ice. The previous PR formula produced an acceptable mix of forwards and defensemen at the top. By increasing the reward for goals and assists by about 10%, PR method 2 also produces an acceptable mix.
What is the Effect of the New Method?
As PR Method 2 helps defensive players and hinders offensive players, and as most of the highest-rated players in the league are offensive players, there will be a slight decrease in the number of players being rated at the PR-Elite or PR-Star levels. There will be a slight increase in players rated in the PR-First5 category.
Comparing the Original Results to the Method 2 Results
Sidney Crosby (PIT, F) has had a long and largely illustrious career. He’s had some seasons where he had to deal with injuries (2010-11, 2011-12, 2019-20). His career PR chart shows very small changes under the two methods. His original chart follows.

His PR Method 2 chart (below) is extremely similar. A close inspection will let you see that the bars on the Method 2 chart are a little lower.

Were These Changes Necessary?
Necessary is a strong word. As the original PR-Scores were not excessively wrong, and as the new PR-Scores are very close to the old PR-Scores, changes were not “necessary.” But the changes were warranted: they were reasonable and justifiable.
Rewarding defensive players using statistics is difficult for two reasons. Firstly, NHL statistics are incredibly slanted towards offense. Secondly, and more importantly, players who are good at defense are put in positions where they have to play defense, which impacts their statistics.
Going Forward
In a separate article, I will give a detailed example of how PR (method 2) is calculated. I do this so anyone who is interested can “look under the hood.” I have visited sites that rated players based on a proprietary statistic that they did not explain, which left a bad taste in my mouth. I hope people who look at my process will see that it is reasonable.
From now on I will use the PR-Method-2 process to generate Productivity Ratings, but will still refer to it as PR. In the related articles section of an article that uses PR, I will, from now on list this article rather than the original Introduction to Productivity Rating.
I have recalculated PR-Scores back to 2007-08. I have also recalculated all of the Value Ratings (VR) back to 2007-08, not because the VR process changed, but because the PR-Scores used in the calculations changed.
Summary
Through work done on other articles, I found that a component of the original PR formula did not reward a player for his defensive play but rewarded him for being put in offensive situations. A better way of measuring a player’s defensive impact replaced this component.
The overall impact of this change in formulas was minimal: total PR-Score across the league based on method 2 was within 99% of the original total; no player had a huge change in PR-Score; higher rated players tended to had a slightly reduced PR-Score (as they tended to be offensive players who benefited from the problematic component).
Some players, in some seasons, changed categories in Method 2. This happened when players just qualified for a category: a player with a PR-Score of 8.01 (PR-Star) dropping a category when the new method gave him a PR-Score of 7.96 (PR-First5). Stuff happens.
Most importantly, PR will continue to be called PR, rather than PR2.
Related Articles
Introduction to Productivity Rating