
An earlier article (Projecting Player Performance – Method) explained how play projections are made. This article will show projections for two selected players from each Canadian team. First up is a sample of the Projection Table, which is presented for each projection.
Projection Table
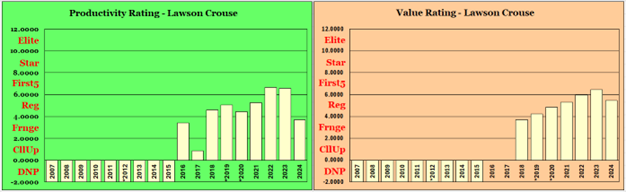
The top part of the projection table shows a player’s history, while the bottom part shows projection information.
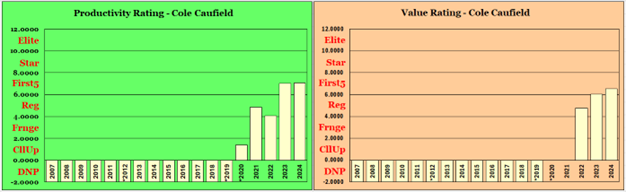
The history is a player’s Career Productivity Rating Chart and his Career Value Rating Chart. PR charts can be quite “bumpy,” while VR charts tend to be “smoother.”
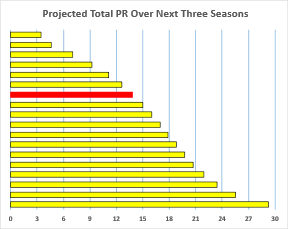
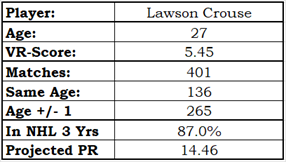
The left side of the second row indicates where the projected player would likely find himself on a typical 18-skater team: Crouse projects to be the 12th-best skater, which corresponds to a third-line forward position. The right side of the second row has a table which contains facts about the projection.
Projection – Nick Suzuki, MTL, F
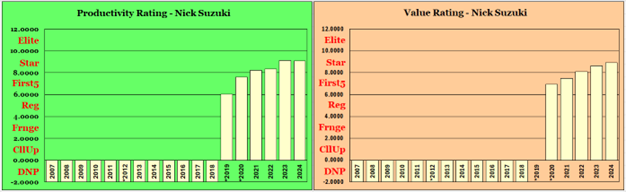
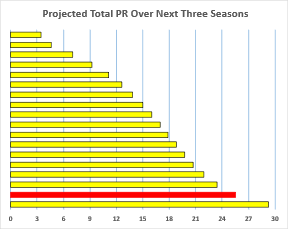
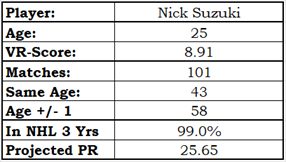
Suzuki projects to be a first-line forward over the next three seasons.
Suzuki’s Career PR and VR charts are exactly what you’d hope to see from a good young player. Each year, he has gotten a little better.
He has a chance of getting into the PR-Elite category in the next couple of years, if he gets some help from his teammates. PR-Scores are based on what a player does on the ice, and players can do more on the ice if their teammates do more. Hockey is a team game.
Projection – Cole Caulfield, MTL, F
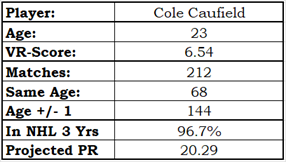
Cole Caufield is an exciting player, and at his age he still has time to improve. He projects as a second-line forward, which may be surprising given Nick Suzuki’s first-line projection.
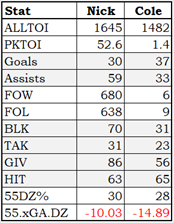
players played 82 games, so comparing their raw counts is fair. Nick had more ice time and way more penalty-kill time.
Cole scored more but had way fewer assists. Faceoffs? It isn’t close (1,318 total faceoffs vs. 15). Suzuki had more blocks and more takeaways, Caufield had fewer giveaways, and they were close on hits.
55DZ% is the percentage of defensive zone faceoffs a player is on the ice for at 5v5 play. Suzuki was used a little more for defensive zone faceoffs, but both figures are below average (32%). The last statistic, 55.xGA.DZ, is the difference between a player’s expected goal data and the average expected goal value of players who had the same amount of defensive zone starts. Both players are negative in this statistic, and neither is in the top 250 players in the league. Defense is an area where both players could improve.
Projection – Jake Sanderson, OTT, D
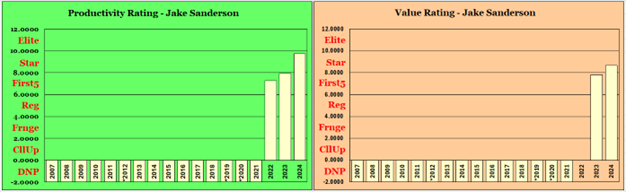

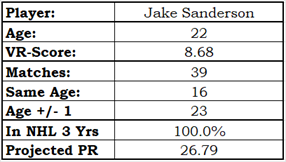
Jake Sanderson is a special player, the proof being the number of matches he has. Only 39 players have had seasons where they were 21 to 23 years old with a VR-Score of 8.18 to 9.18.
A partial list of players who were age-22 matches is: Adam Fox, Cole Makar, Drew Doughty, Erik Karlsson (!!) and Quinn Hughes. That is one heck of a good set of players to be part of. Sanderson projects to be a first-pair defenceman, a #1D.
Projection – Timmy Stutzle, OTT, F
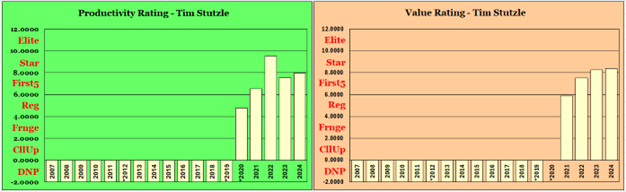

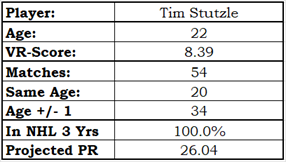
Stutzle, like Sanderson, is a special player. The evidence is his number of matches: 54.
I have a feeling that Stutzle had an injury in 2023-24 that significantly impacted his play, and that he has not yet completely recovered from it. That is based on his lack of scoring touch these last two years and his not being used on the penalty kill.
In 2021-22 and 2022-23 Stutzle scored 61 goals compared to 51.39 individual expected goals (ixG). In 2023-24 and 2024-25 Stutzle scored 46 goals compared to 42.62 ixG. In these last two seasons he has generated fewer scoring chances (drop in ixG) and has converted those chances at a lower rate (119% vs. 108%).
In the same two-year slices, Stutzle’s penalty-kill time-on-ice dropped from 109 minutes to 56 minutes. Actually, the big drop in his PK time came last season, when he had just three minutes of penalty kill time for the season.
The Player Projection Method (PPM) doesn’t know about my suspicions that Stutzle has a lingering issue, and projects him to be a first-line forward.
Projection – William Nylander, TOR, F
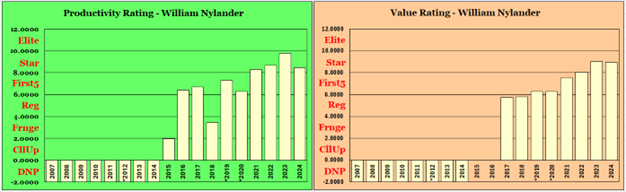
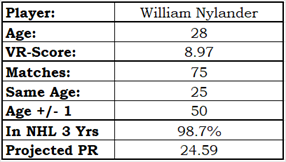
Nylander projects to be a first-line forward.
Toronto has a wealth of talent at forward, presently. They have Auston Matthews, who is one of the best players in the league when healthy. They have William Nylander and Mitchell Marner (when I started working on this article).
They also have John Tavares, but he’s six years older with a VR-Score of 8.30. Tavares projects as a second-line forward. Matthew Knies rounds out the top-five forwards from Toronto’s 2024-25 team, all of whom had better PR-Scores than their highest rated defenceman (Morgan Rielly).
Toronto would be a better team with one fewer very good forward and one more very good defenceman. Such a trade would be a blockbuster, but you need a team that has a defenceman they are willing to move and that will accept a forward you are willing to move.
Projection – Mitchell Marner, TOR, F
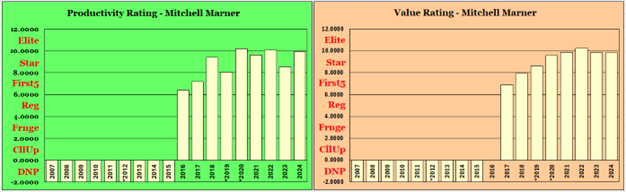

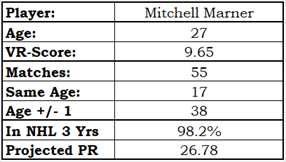
Marner projects to be a first-line forward. His projection is higher than that of Nylander.
Toronto fans have decided that the current mix of players isn’t producing parades, and it’s time to jettison a big name. That’ll shake up the locker room! The perception in Toronto is that Marner hasn’t produced in the playoffs, so I looked at the playoff data from the last three seasons. In that time, Marner has one more point than Matthews. Logically, shouldn’t the fans be targeting the bigger star who is producing even less in the playoffs?
It looks like the fans of the shake-up got their wish, as Vegas has acquired Marner. It is hard to see how this has made Toronto a better team.
Projection – Josh Morrissey, WPG, D
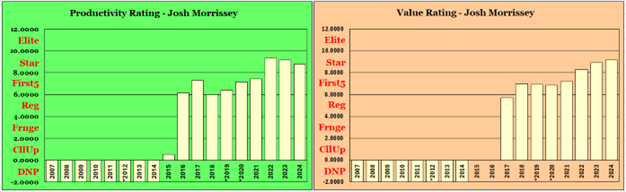

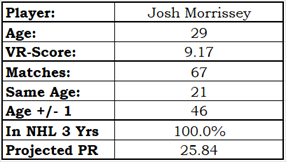
While Josh Morrissey’s PR-Scores declined over the last two seasons, his Value Rating increased. VR-Scores are calculated based on three seasons of data. Morrissey’s 2022-23 VR was based on 2020-21, 2021-22 and 2022-23. The next season 2020-21 data was replaced by 2023-24 data, and last season his 2021-22 data was replaced by 2024-25 data. While his PR-Scores in the last two seasons was slightly lower than his 2022-23 season, they were much higher than the 2020-21 and 2021-22 seasons, so his VR-Scores increased.
As you would expect based on a simple subjective appraisal of Mr. Morrissey, he projects to be a #1 Defenceman.
Projection – Neal Pionk, WPG, D
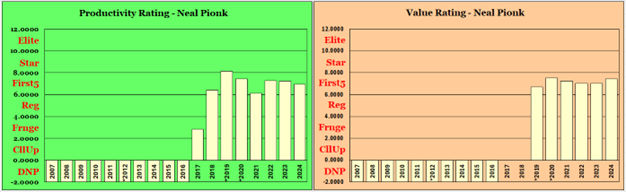

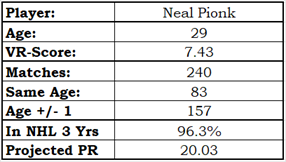
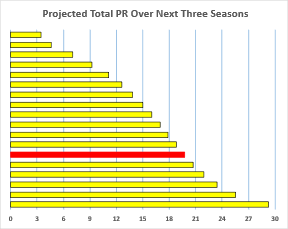
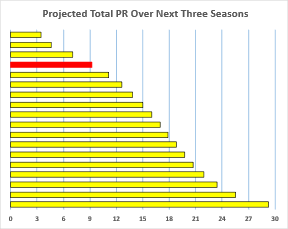
The red bar in the Projected Total PR chart places Pionk as the sixth best player on an average team, which makes him a strong #3D or a below-average #2 D. On Winnipeg he is a solid #2 D, and is the defensive yin to Josh Morrissey’s offensive yang.
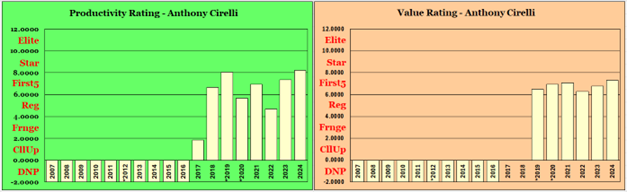
As a complete aside, Neal Pionk’s career PR and VR charts are almost identical to those of Anthony Cirelli. There is a little more variation in the PR chart, which is to be expected as PR-Scores are more “volatile.” The VR similarity is striking.
The red bar in the Projected Total PR chart places Pionk as the sixth-best player on an average team, which makes him a strong #3D or a below-average #2 D. On Winnipeg, he is a solid #2 D, and is the defensive yin to Josh Morrissey’s offensive yang.
As a complete aside, Neal Pionk’s career PR and VR charts are almost identical to those of Anthony Cirelli. There is a little more variation in the PR chart, which is to be expected as PR-Scores are more “volatile.” The VR similarity is striking.
Projection – Zach Hyman, EDM, F
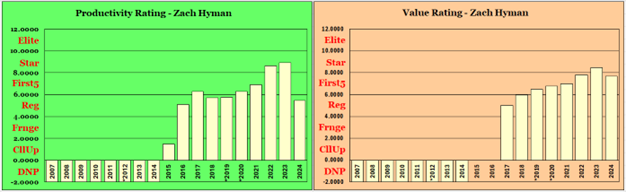
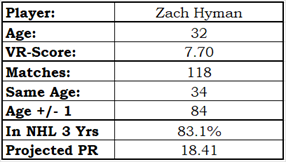
Hyman’s PR-Score dropped this season due to his missing ten games and not scoring as much as he did the previous two seasons (27 goals last year, 90 in the previous two seasons). It wasn’t just scoring: his assist total went from 70 over the previous two seasons to 17. That drop in offence cost him about 2.5 PR-Points.
Was his decline in 2024-25 age-related? It could very well be. He is at the ripe old age where players start to decline simply because they are of a ripe old age.
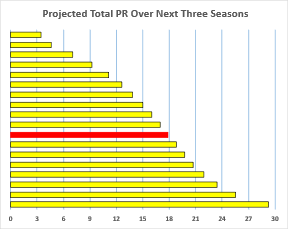
He projects to be a second-line forward.
Projection – Adam Henrique, EDM, F
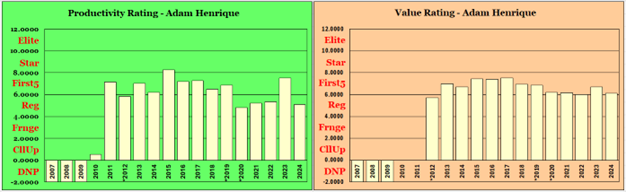
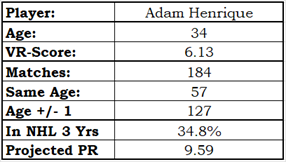
Henrique is two years older than Hyman and is nearly a full VR-Category lower rated (the difference between their VR-Scores is 1.57 PR-Points, and a VR-Category is 2.00 PR-Points wide).
The projection for Henrique is much less rosy than Hyman’s: a fourth-line forward who has a 35% chance of still being in the NHL in three years. If you look at his last five seasons, you’ll see that he has been playing at the third-line or good fourth-line level (PR-Scores in the bottom middle of the PR-Regular category).
His 2023-24 season was an exceptionally good season for him, boosted largely by the statistics he had in Anaheim before his trade to Edmonton. He had good puck luck then but returned to form in 2024-25. Puck luck does not last forever, and you have to enjoy it when you have it.
Projection – MacKenzie Weegar, CGY, D
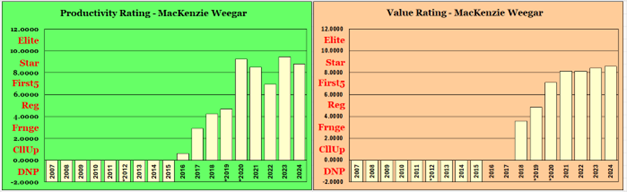

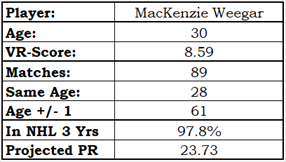
Weegar projects as a first-pair defenceman.
His inauspicious start in Calgary (2022-23) looks like he was having bad puck luck. Compared to his two prior seasons and two subsequent seasons, he was down 8 goals and 10 assists.
Now, the thought that he had bad puck luck is subjective, and it could be affected by various poor thinking techniques: the hasty generalization fallacy, where one makes a broad claim based on limited evidence, or the Texas sharpshooter fallacy, where one focuses on a subset of data while ignoring the rest of the data.
The problem we face when we try to determine why a player declined in a certain season is that the data doesn’t have context. Determining “why” something happened is basically impossible given the available data.
Projection – Rasmus Andersson, CGY, D
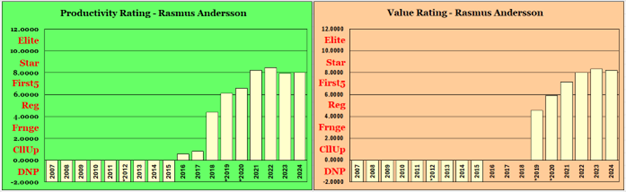
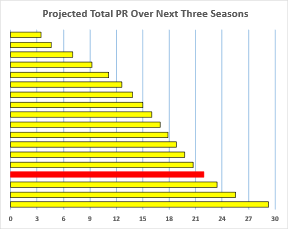
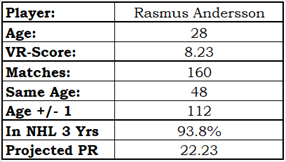
Calgary has two players whose three-year projection is first-pair defenceman: Weegar and Andersson. As a team, that’s a pretty good place to be. Going into this season, Calgary’s defensive corps has two top dogs. And I wondered how often these top dogs were on the same leash, as it were.
In the last three seasons at 5v5 play, Weegar and Andersson have generally played apart from each other. Andersson was on the ice for 4,272 minutes and Weegar for 3,452 minutes; together, they were on the ice for 1,091 minutes. Andersson’s most usual partner was Noah Hanifin (1,182 minutes), while Weegar’s usual partner was Andersson.
Weegar is more offensive than Andersson, especially when not paired with him. Weegar’s most effective partner was Christopher Tanev: Calgary was +0.69 expected goals per 60 minutes (xG60) when this pair was on the ice. The Weegar-Andersson pair was +0.01 xG60.
While Weegar and Andersson both project as first-pair defencemen, they shouldn’t get a lot of ice-time as a pair. They are more effective when paired with other defencemen, especially when those defencemen have complementary skill sets.
Projection – Quinn Hughes, VAN, D
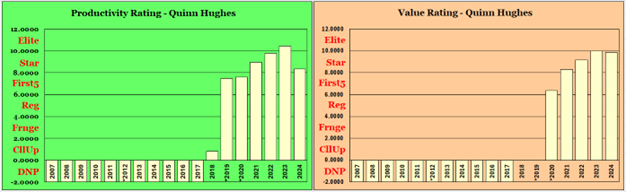

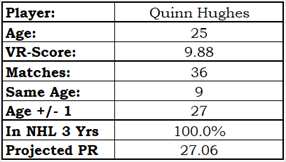
Quinn Hughes is a unique player, as can be inferred from the number of matching players he has: 36. He projects to be a #1 defenceman over the next three seasons.
Hughes had an off year in 2024-25, as did his teammate Elias Pettersson.
Projection – Elias Pettersson, VAN, F
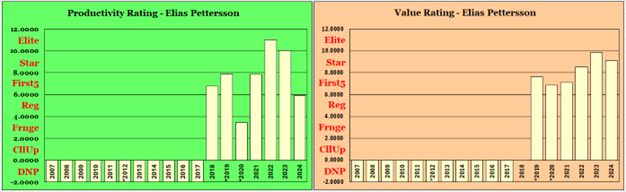

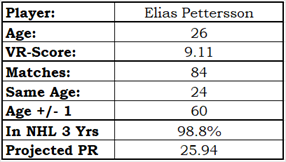
Despite two consecutive “off” seasons, Pettersson projects as a first-line forward.
Did Vancouver’s overall drop cause Pettersson and Hughes to have bad seasons, or was it the drop in production from Pettersson and Hughes that caused Vancouver’s decline? The answer is (probably) yes.
I looked at the ten best players who played only for Vancouver in 2023-24 and 2024-25, which excluded J.T. Miller and a few others. I then compared their PR-Scores in those two seasons. Quinn Hughes, Brock Boeser, Filip Hronek and Dakota Joshua were all down one full PR-Category in 2024-25 (all down between 2.07 and 2.21 PR-Points). Elias Pettersson was down two PR-Categories (4.10 PR-Points).
All of these players missed games in 2024-25. When taking games played into allowance for both seasons, the two biggest drops in performance came from Joshua and Pettersson (2.49 and 2.43 PR-Points down). Hughes was down only 0.38 PR-Points.
So, if you have to lay blame on specific players on Vancouver, you have to blame Pettersson and Joshua. And I don’t think J.T. Miller should get off scot-free, but analyzing his impact on Vancouver takes a lot more effort than I’m presently willing to invest.
Summary
I have greatly enjoyed playing around with the data generated by the Player Projection Method (PPM). The ultimate proof of PPM’s validity would come three years from now, when the projections made in this article and the Projecting Player Performance – By Age article can be compared to what actually happened.
Related Articles
Projecting Player Performance – Method