
Projecting any player’s performance is an act of extrapolation: extrapolating is estimating something by assuming that existing trends will continue. In this article, the thing being estimated is a player’s total Productivity Rating (PR-Score) for the next three years, and the existing trends will come from players who were close to a player-of-interest in age and in Value Rating (VR-Score). The process for doing this estimation is inventively called the Player Projection Method, or PPM.
If you are not interested in an explanation of how the projections were calculated, go directly to Projections – Lawson Crouse. The explanations will always be here if you get curious and want to circle back.
Example of Value Rating Calculation
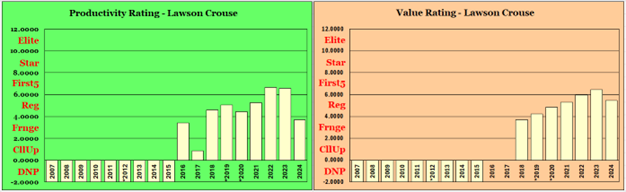
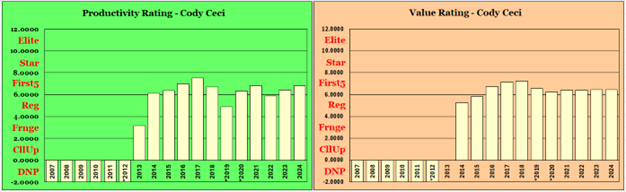
The data source for the example PPM calculations is Lawson Crouse (F, UTA). His career PR and VR charts are below. By the way, the unit of measurement for both PR-Score and VR-Score is PR-Points, aka PRPts. PR-Score and PR-Points can be used interchangeably: Bobby Clobber had a PR-Score of 3.92; Bobby Clobber had 3.92 PR-Points.

The Productivity Rating Chart is normal, except for the years 2017-18 and 2024-25. The first dip is caused by his having played only eleven games in 2017-18, while the second dip is explained by his having played only eleven good games (out of 81 games played) in 2024-25. I found nothing online that said he was playing through an injury, but the data implies that he did.
His Value Rating Chart is normal, but for the size of the drop in 2024-25 (which was caused by his unusually poor PR-Score). He first played at age 19 in 2016-17, and his value improved each season: as young players age, they tend to get better. At 27, Crouse has reached the age where further increases in VR would be a little unusual.
VR-Score is a weighted average of PR-Scores from the previous three seasons. After calculating a player’s VR-Score based on playing 82 games (a full season), a downward adjustment is made for players who missed games.
The season weights (VR.Wt in the table below) are 5 for the most recent season, 4 for the previous season and 3 for the season before that. If a player didn’t play in a previous season, both his games played and PR-Score are set to zero.
Not every player gets a Value Rating every season. To qualify for VR, a player must have played at least one game in the season and at least half of the scheduled games over three seasons.
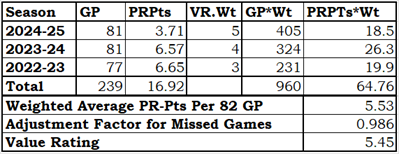
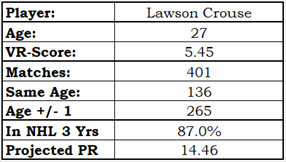
The table shows Lawson Crouse’s pertinent VR data. He played at least one game in 2024-25 and played well more than 123 over three seasons, so he qualifies for a Value Rating.
The Total row (fourth data row) shows his totals in GP*VR.Wt and PRPTs*VR.Wt, which are the weighted totals of games played and PR-Points. On the next line, Crouse’s 82-game weighted average ( ( 82 * 64.76 ) / 960 ) is shown: 5.53.
Stapled to the Bench (STTB) believes there is value in playing games. Players who missed games should have their 82-game VR-Score decreased a little. STTB is nothing but generous, so the decrease is related to the square root of the percentage of games a player has played over the three seasons. Crouse played 239 games, 239/246 is 0.972, and the square root 0.972 is 0.986. (Had Crouse played 139 games: 139/246 is 0.565, and the square root of 0.565 is 0.752).
A player’s Value Rating in a season is his 82-game weighted average PR-Points multiplied by the missed-games adjustment factor. For Crouse, that is 5.53 * 0.986, which is 5.45.
563 players qualified for Value Rating in 2024-25, and Crouse’s 5.45 put him in 282nd place.
How Projections For a Specific Player Were Made – Finding Matches
Three-year projections for a player-of-interest are based on other players who were roughly the same age, had about the same VR-Score, and who could have had three seasons of play after the matching season. A lot is going on in that sentence, so let me parse it out.
When looking for a match to a player-of-interest, the potential matching player had to be within one year of age and within 0.50 PR-Points of the player-of-interest’s VR-Sc0re. To have three seasons of play after their matching season, the matching season had to have been between 2007-08 and 2021-22.
Lawson Crouse’s matches were players aged 26 to 28 whose VR-Score was in the 4.95 to 5.95 range in a season between 2007-08 and 2021-22.
As it turns out, 401 players fit that set of criteria. 136 of them were Crouse’s age, and the other 265 were either one year older or one year younger.
How Projections For a Specific Player Were Made – Getting to a Number
Each matching player’s subsequent three years of games played, and PR-Scores are gathered. If a matching player did not play any of the “future” three seasons, it counted as zero games played, and his PR-Score counted as 0.00. Data from a player with an exact age match counts twice as much as data from other players.
For each player-of-interest, I calculated the average total PR-Score of his matching players and the percentage of those players who were still playing three years later. For Lawson Crouse, the matching group’s average total PR-Score was 14.46 (which is 4.82 per season, which is just below the exact middle of the PR-Regular category), and 87% of the matched players were playing three seasons later.
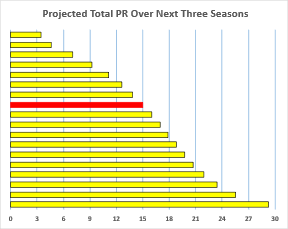
For most readers, there is no chance that a three-year total PR-Score of 14.46 is a useful piece of information. A picture of where this total PR-Score would put him on an average team would be much more useful.
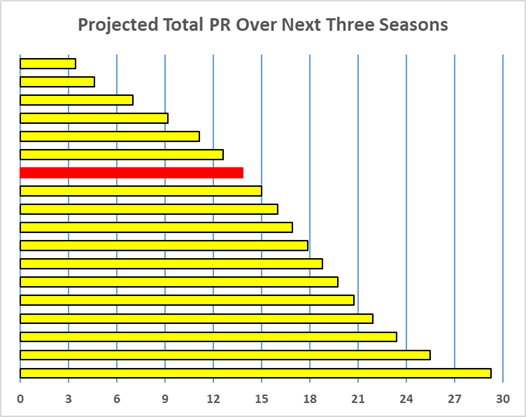
The Projected Total PR chart has 18 bars, representing the 18 skaters a team ices each game. The length of a bar represents a skater’s three-year PR-Points, with the better players at the bottom and the lesser ones at the top. The red bar represents the player-of-interest. Crouse projects to be the 12th best player on an average team over the next three seasons.
Projection – Lawson Crouse
This “projection table” brings together Crouse’s past and projected future, showing how he got to where he is and where he might be going as a result. He projects as a PR-Regular for the next three seasons, a solid third-liner.
His chances of still being in the NHL in three seasons is 87%. 52 of the group of 401 matching players did not play a game in the third season after their matching season.
This projection may seem pessimistic to both of the fans of Logan Crouse, but it is based on a group of 401 very similar players.
I’ll show one more projection, just for fun.
Projection – Cody Ceci
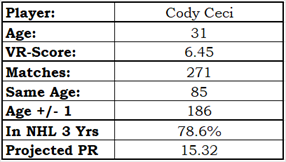
I jokingly say that Cody Ceci is my son’s favourite player. Ceci’s biggest problem when he was with Ottawa was that he didn’t perform like Wade Redden did in his prime. Fans wanted him to be a better player than he was because … well, they just wanted it. In many fan bases, the blame for a team’s inadequate performance will be laid at the feet of a specific player (see: Toronto 2024-25 and Mitchell Marner). In Ottawa, it’s normally a defenceman who gets targeted (Karlsson very early in his career, Ceci and Chabot have all been targeted).
Ceci’s last season in Ottawa was 2018-19, a season in which he had a minor decline in performance. From fan commentary at the time, you would have thought that he spent most of his time on the ice passing the puck to the opposition.
Since 2021-22, his Value Rating has been exceptionally consistent: 6.41, 6.42, 6.46 and 6.45.
He projects as a second-pair defenceman and has an excellent chance to still be playing at age 34. Pretty good results for a guy the Ottawa fanbase thought was worthless at age 25.
Summary
I have looked at the PPM results of dozens of players, and the projections are logical with respect to each other. Better players project to have better futures than regular players, and regular players project to have better futures than the lesser lights. Young players project to improve a little bit, while older players project to decline.
I presume the projections are slightly pessimistic, especially when a small number of matching players didn’t play three years down the road. That small group will have a big impact on the average PR-Scores for the group.
Two related articles will show projections for various individual players. One article will present players by age, and the other will look at pairs of players who were on Canadian teams at the end of the regular season.
Related Articles
Projecting Player Performance – By Age
Projecting Player Performance – Canadian Teams