
2025-26 Season Charts

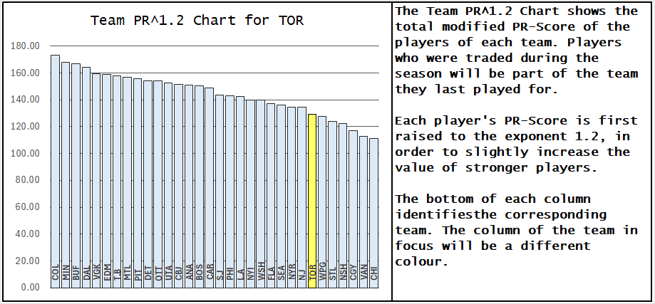
Toronto is in the bottom quarter of the league in their skaters. If Matthews and Nylander had both played around 76 games (minor injuries only during the season), their bar would have been in the part of the chart that has Washington (WSH) and the Islanders (NYI).
There was more to this decline than the injuries of these two players.


Their penalty kill play was terrible, but their penalty kill results were well above average. Normally that would be a credit to the goalies, but Toronto’s goalies were below average.


Productivity Ratings
I wanted to go into a little depth about Productivity Ratings, and chose to do it in the Toronto article.
Productivity Rating (PR) consists of a number (PR-Score) and a category (PR-Category) based on that number. PR-Score is calculated using eighteen NHL player-level statistics. It will normally produce a value between zero and ten, but is open ended, so exceptional seasons can produce values above 10.0. The unit of PR-Score is called PR-Points.
There are six PR-Categories. From bottom to top, they are PR-CallUp, PR-Fringe, PR-Regular, PR-First5, PR-Star and PR-Elite. Each category is 2.0000 PR-Points wide: PR-Regular is assigned to players whose PR-Score is between 4.0000 and 5.9999. PR-Elite is for PR-Scores above 10.0000.
PR-Score provides the data for three of the team charts: Team PR^1.2; Lines and Pairs; Top Five Players.
Team PR^1.2 Chart
It may surprise Maple Leaf fans to see Toronto placed so lowly on this chart. While Matthews and Nylander missed 39 games between them hurt a little, the bigger reason for Toronto’s low placement is a decline in play of all their players. And not having Marner.
Lines and Pairs Chart
Players are assigned to lines or pairs based on their PR-Score. The three forwards with the highest PR-Scores are designated as Line 1, even though they may not play together. The chart shows that all four of Toronto’s lines, its top twelve forwards, were below league average. The first and second defensive pairs were also below average. Only the third pair for Toronto, Troy Stretch and Brandon Carlo, was (technically) above average.
In 2025-26, Toronto’s players were below average.
Top Five Players Chart
Auston Matthews dropped down the rankings in PR-Score at the end of the season because he missed the final sixteen games of the season to a dirty hit from a dirty player.
Through extrapolation, an estimate can be made of what his final statistics would have been had he been healthy his final sixteen games.
Matthews had played 60 games when he was injured, and the Leafs had 16 games remaining. Had he been healthy for the end of the season, he would have played 76 games. No matter how healthy he was, no matter how well he played, he wasn’t going to get back those six games he missed earlier on.
To extrapolate his season statistics, I multiply each one by (76/60). For example, he had scored 27 goals before he was injured, and multiplying 27 by 76/60 gives you 34 (rounded to the nearest whole number).
After all of his contributing statistics have been extrapolated, the PR formulas convert those statistics to PR-Points. Continuing to use goals as an example, PR awards 0.084 PR-Points for each goal scored: 34 goals would be worth 2.8560 PR-Points.
The final step is to sum up all the PR-Points a player has earned and then add 0.5000 PR-Points to that total, which produces his PR-Score. Matthews’ extrapolated PR-Score is 8.4476, putting him in the bottom of the PR-Star category (8.0000 to 9.9999). Instead of finishing 130th in the league, he would have finished about 40th.
Since 2020-21, Matthews has been a top-ten player in the league. Saying that he would have finished 40th had he been healthy means that he was not having a good season before the injury. Is this an unexpected side-effect of “trading” Mitchell Marner to Vegas?
Career Value Rating of Auston Matthews
It is hard to believe that Matthews has been playing in the NHL for ten seasons. It seems like just a few years ago that he was mercilessly torching Ottawa in his professional debut.
Value Rating is an estimate of how valuable a player is. It is normally calculated using the PR-Scores and games played from the previous three seasons, but can be calculated for a two-year span provided enough games were played.

Has Matthews started his age-related decline? His PR-Scores from the last two seasons were affected by injuries. If he stays healthy next season and performs at his normal level, his VR-Score will improve. On the other hand, Matthews has a history of missing games. He’s already missed more than one season’s worth of games in his career.
Looking Forward

Toronto does not have young talent, but they miraculously won the lottery draft. Interestingly, if they hadn’t lost Matthews for the last sixteen games of the season they almost certainly would not have been one of the bottom five teams in the league, which means they would have lost their first-round draft pick to Boston. Every cloud has a silver lining, I guess.
Toronto’s future is hard to estimate. My impression is that the RFS data is artificially low in terms of their existing talent (especially with regard to Matthews and Nylander). They will be getting the number one pick, but will that player be a Macklin Celebrini or an Alexis Lafrenière? Will the team play better defense? Will the goalies play better? If Matthews and Nylander stay healthy through the season, if they get reasonable play from their #1 pick, and if they play much better defensively, they should be back in the playoffs in 2026-27. I’d say the Leafs will struggle to make the playoffs next season, but that could be because I’m an Ottawa Senators fan. It also could be because there are a lot of “ifs” tied to their returning to the playoffs.