
Have you ever wondered who scored the goals that mattered? Have you ever wondered which goals mattered, for that matter?
In an Edmonton-Vancouver game at the start of the season, Kasperi Kapanen scored at 8:23 in the second period to give Edmonton an 8-2 lead. At first glance, this looks to be a goal that doesn’t matter. But the final score of the game was 9-7, so an argument could be made that this was a goal that mattered. Indeed, many people would view it as the game-winning goal.
As there are no official statistics that describe the value of goals, I went ahead and created a couple. One statistic will value goals based on how much they improved a team’s chances of victory at the moment they are scored, the other will value goals based on how much they contributed to a team’s victory considering the final score of the game.
When This Article Was Written
The research for this article began days after the 2025-26 regular season ended, while the writing of this article began at the end of September 2026, while I was incapacitated with a bad back while on vacation in Canterbury, England. It continued well into October, as I was recovering from the vacation and my bad back.
Data Source
With the help of AI, an R script was developed which retrieved NHL goal-data from every game played in 2025-26. It provided anonymous data, with games, teams and players identified by numbers. For example, I could see that player 8477934 scored a goal in the 5th minute of game 2025020450 for team 22, giving them a 2-0 lead in an eventual 6-2 win.
Only after I had run all the numbers did I bother to find out that team 22 was Edmonton and player 8477934 was Leon Draisaitl.
Creating Statistics That Value Goals When They are Scored
I first needed a statistic that assigned a value to the margin of the score at a specific point in the game. It would tell us how much a two-goal lead was worth in the 5th minute of a game, for instance. I decided that the value of a goal should be stated in terms of standing points. This statistic is called Expected Standing Points (xspts).
For example, let’s look at Draisaitl’s previously mentioned goal. Teams with a two-goal lead in the 5th minute of a game earned an average of 1.563 standing points: xspts=1.563.
The value of a lead is not the same as the value of the goal that produced that lead. Consider a goal scored in the last minute of a game that increased a team’s lead to five goals: the team’s xspts is 2.000, but the goal itself is obviously meaningless, as a team with a four-goal lead in the last minute also had xspts of 2.000.
The value of a goal is measured in how much the goal changed a team’s xspts. A one-goal lead in the 5th minute is worth 1.412 xspts, so a goal that increased the lead is worth 0.151 xspts. This is called Standing Points From a Goal, or spfG: spfG=0.151.
Various Notes About xspts and spfG
When the puck is dropped at the start of the game, the score is 0-0 and the game is tied, and the first minute of the game begins. The xspts at that time is 1.125 for both teams, reflecting the potential of the extra standing point a losing overtime team gets. As the game goes on, tie scores have higher xspts values, as the game is more likely to go to overtime.
Five-plus goal leads were deemed unbeatable, while file-plus goal deficits were deemed hopeless. Any goal that increased a lead to more than five goals was worth 0.000 spfG, and any goal that left a team five or more goals behind was also worth 0.000 spfG. These are “worthless” goals, stat-padders. The 8-2 goal noted in the introduction was a worthless goal.
Going into overtime, each team can expect 1.5 points (one point for the overtime bonus, and half the time they will get a second point for winning in overtime or in a shootout). Overtime goals are therefore worth 0.500 spfG, the difference between 2 and 1.5.
Shootout goals are ignored.
The calculation of xspts was based on data from every 2025-26 game. Where the raw data produced atypical results, which happens as a result of a small number of data points in some situations, the raw results were “artistically sculpted” so that xspts data was logically consistent across all leads and from the first minute of a game to the last minute of overtime.
The first logical consistency is that the bigger the lead at a given point in time, the higher the xspts value of that lead. An example of lead sizes in a given minute of the game follows.
You may notice that being up four goals in the 37th minute has xspts=2.000, which implies the lead is unassailable. Yet the value of a four-goal deficit is 0.036, not 0.000. Such variations may have happened because of the “artistic sculpting”, but it is also possible that one team was down four at this moment in time, came back to tie the game, and lost in OT.
The other logical consistency is that leads of the same size are worth more as the amount of time left in the game decreases. An example follows.

You may notice that being up four goals in the 37th minute has xspts=2.000, which implies the lead is unassailable. Yet the value of a four-goal deficit is 0.036, not 0.000. Such variations may have happened because of the “artistic sculpting”, but it is also possible that one team was down four at this moment in time, came back to tie the game, and lost in OT.
The other logical consistency is that leads of the same size are worth more as the amount of time left in the game decreases. An example follows.

A goal that is worth 0.400 or more spfG is a “big goal”, while a goal that is worth 0.100 or less spfG is a “trivial goal”.
An Example of spfG From an Early 2026-27 Game
Rather than use Edmonton’s 9-7 win for this example, I picked the earlier Edmonton-Vancouver game which was won by Vancouver in overtime (6-5).
In the table, Game Score is from the perspective of the scoring team. Pettersson’s score made the score 5-2, Podkolzin’s first score made the score 3-5.
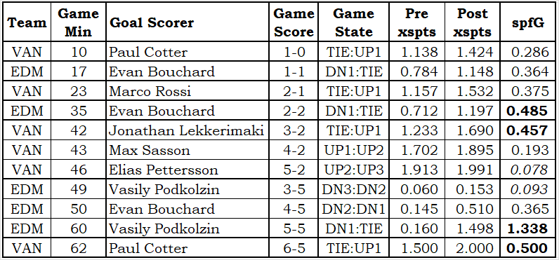
Bouchard’s first two goals are more valuable than the Vancouver goals that preceded them because they had a bigger impact on his team’s expected standing points. The difference between being down one goal and tied is bigger than the difference between being tied and one goal ahead.
Bouchard’s 35th minute goal was a big goal (spfG of 0.400 or more). Lekkerimaki’s goal is also a big goal, as it gave Vancouver the lead in the third period. The next two Vancouver goals are less valuable. Elias Pettersson’s goal that gave his time a 5-2 lead is a trivial goal (spfG of 0.100 or less).
Podkolzin’s first goal is also a trivial goal (0.093 spfG). Bouchard’s goal brought his team to within one with ten minutes to go. Technically, it was not a “big goal”, but it was close.
Podkolzin’s last-minute game-tying goal is a big goal (1.338 spfG), a huge goal. Last-minute game-tying goals are the most valuable goals that can be scored.
Perhaps appropriately, the player who started the scoring also ended it. All overtime winning goals are worth 0.500 spfG, and so they are all big goals. (The value to use as the cutoff for big goals was arbitrarily selected, but I’d look like an idiot if it excluded overtime goals.)
Two goals in this game were trivial at the moment they were scored but eventually became important as the game went into overtime. More on that later!
2025-26 League Leaders in spfG
The following table shows the top 20 players in spfG.
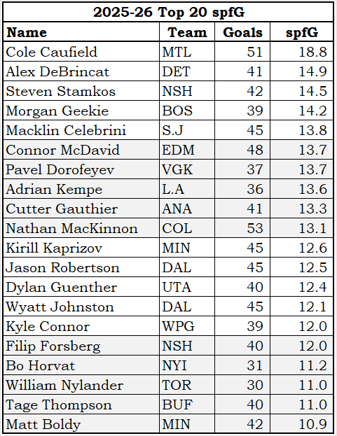
Cole Caufield (MTL) was far and away the leader in spfG. The gap between Caufield and Alex DeBrincat (DET) is about as big as the gap between DeBrincat and Matt Boldy (20th).
While spfG was calculated to three digits of precision, the values in this table are shown with one digit of precision. Just because a statistic can be calculated with great precision (number of decimal places), that doesn’t mean the statistic is accurate (reflecting true differences in the abilities of players). Precisely, Kyle Connor’s (WPG) spfG was better than Filip Forsberg’s (NSH), based on their precise totals of 12.000 and 11.954. Practically, their spfG values were equivalent.
Creating Statistics That Value Goals When Considering the Final Score
So far we have looked at the value of goals at the time they were scored. A goal giving a team an 8-2 lead had no “value” as it did not change the team’s likely outcome: they were sure to win when the score was 7-2. But because the game ended 9-7 there will be people who claim that every goal is important. Just so you know, I consider that to be an “outcome bias” fallacy.
As in any good Monty Python sketch, I can take absurd logic and use it consistently. If every goal is important in a win, I can assign values to those goals accordingly.
For this approach I will be using the same data as was used for spfG, which has all goals scored in regulation or overtime: no shoot-out goals.
Goals will now be valued based on the game outcome. The logic to me is a little absurd, but if you think the goal that expands a team’s lead to 8-2 is important than you’ll be forced to agree with it. This statistic is called Points-Share (PtsShr), and it assigns a value to a goal based on the game result and the number of goals a team scored in the game.
In a regulation or overtime win, each goal the winning team scored gets an equal share of the two points a team gets in a win. If a team wins 5-4, each goal they scored is worth 0.4 PtsShr (2 standing points/5 goals scored). If a team wins 5-0, each goal is also worth 0.4 PtsShr, as the margin of victory does not impact the value of goals scored.
In games that end in shootouts, each goal scored by each team will receive an equal share of 1.5 standing points per team. In a game that went to shootout with the score 3-3, each goal would have a PtsShr of 0.5 (1.5 standing points/3 goals scored).
In an overtime loss, the team that lost still earned a standing point, so each goal they scored has value. A 5-4 overtime loss will see the losing team’s get 0.250 PtsShr (1 standing point/4 goals scored).
In a regulation loss, the losing team’s goals have a PtsShr of 0.0. They didn’t earn any standing points, so the goals they scored are essentially worthless.
I calculated the goal value of each goal scored in regulation or overtime based on the above rules, added up those values for each player in the league, and can now share with you the players who scored the most when their teams won or tied a game.
To harken back to the goal-by-goal example from the Edmonton-Vancouver game, each Edmonton goal has a PtsShr of 0.333 (2 standing points/6 goals) and each Vancouver goal has a PtsShr of 0.200 (1 standing point/5 goals).
2025-26 Leaders in PtsShr
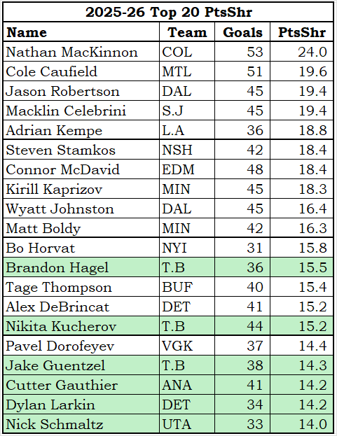
Nathan MacKinnon (COL) scored a lot of goals for a team that earned a lot of standing points through the year. His lead in PtsShr is big because he scored a number of goals later in games in which his team was already well ahead, and only two of his goals came in regulation losses. 51 of his 53 goals were worth some amount of PtsShr.
Cole Caufield (MTL) trails MacKinnon in PtsShr because he scored a lot of goals (12!) in games that Montreal lost in regulation. His lead in spfG came from his scoring goals in close games, usually in the second half of a game.
The green-shaded rows show players who were not in the top twenty for spfG. Nick Schmaltz (UTA) was 52nd in the league in spfG. To be fair to Mr. Schmaltz, Utah had a league-average team total spfG, and he was his team’s leader in spfG.
Summary
In case it wasn’t obvious, I think spfG is a much better way to determine which players scored important goals. Deciding that a goal that gave a team an 8-2 lead was important based on the final score of 9-7 is, well, somewhere between silly and absurd.
I like to treat things equally and fairly: spfG values all goals that give a team a one-goal lead in the seventh minute of a game equally, regardless the final score. That’s equal and fair.
In PtsShr, the value of that 7th minute goal cannot be determined until the game is over. It could be worth 2.000 PtsShr (1-0 win), it could be worth 0.500 PtsShr (4-2 win), it could be worth 0.333 PtsShr (3-4 overtime loss), it could be worth 0.250 PtsShr (7-6 or 6-7 shootout), and it could be worth 0.000 PtsShr (1-2 regulation loss).
To me, PtsShr suffers from two forms of bias: outcome bias (judging a goal on the eventual outcome rather than on the situation at the time it was scored) and hindsight bias (the final score makes a goal seem more important that it was when in was scored).
Cole Caufield scored the most important goals in the league, without question.
- He scored 26 big goals (goals worth at least 0.4 spfG); Steven Stamkos (NSH) was second with 17.
- He scored 29 goals that gave his team a one-goal lead; Dylan Guenther (UTA) was second with 19.
- He scored twice as many big goals and twice as many lead-taking goals as Nathan MacKinnon.
Related Articles
None